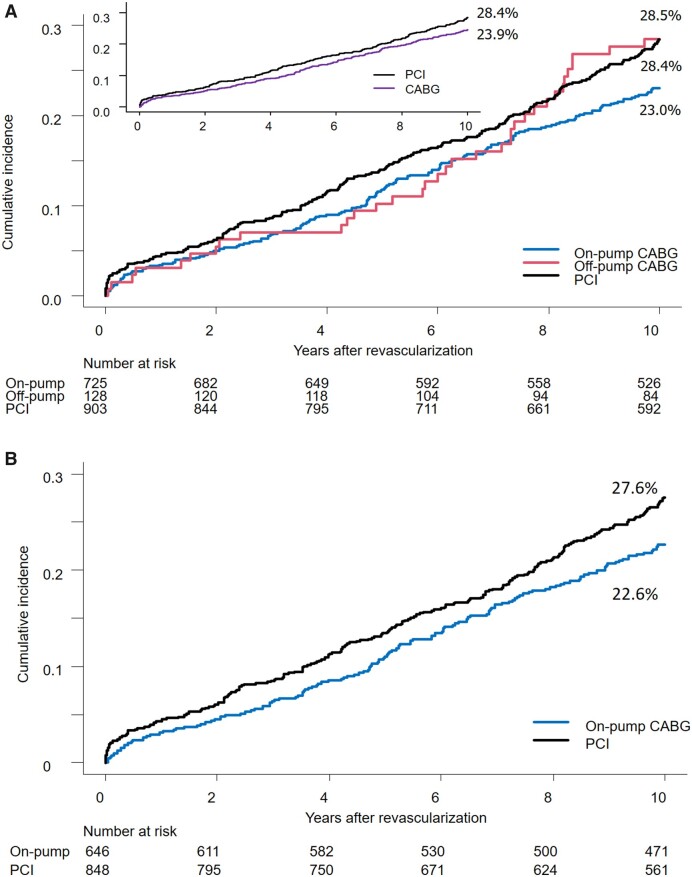
Figure 3:
Crude and adjusted survival curve of 10-year mortality. (A) Crude survival curve of 10-year mortality. Image (A) shows rude Kaplan–Meier mortality curves in 3 groups (on-pump CABG, off-pump CABG and PCI). (B) Inverse probability weighting-adjusted survival curves of on-pump CABG and PCI. Image (B) shows inverse probability weighting-adjusted survival curves of on-pump CABG and PCI. CABG: coronary artery bypass grafts; COPD: chronic obstructive pulmonary disease; EF: ejection fraction; PCI: percutaneous coronary intervention.

