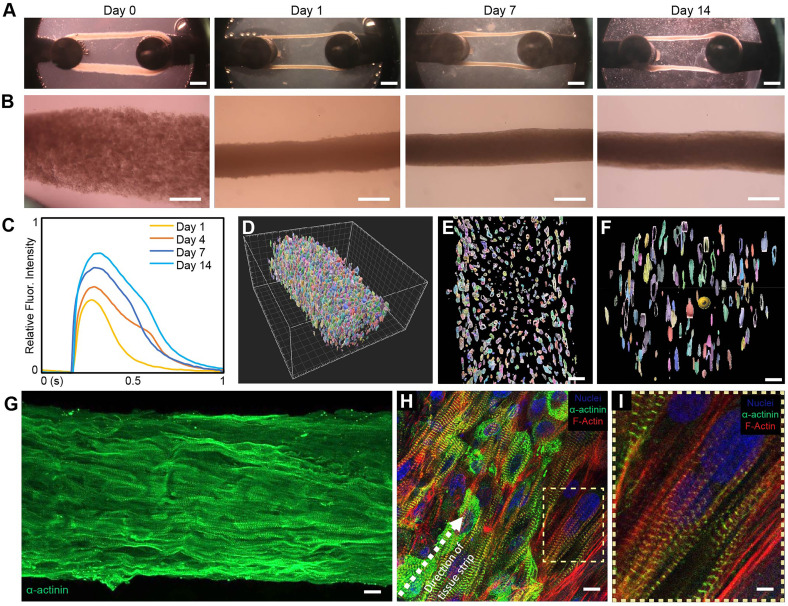
FIG. 2.
Structural characterization of the FRESH™ printed cardiac tissue. (a) Brightfield images of cardiac tissue strips throughout time in culture show compaction and remodeling of tissue strip over time. Scale bars are 1 mm. (b) Higher magnification images of tissues during culture. Scale bars are 100 μm. (c) Calcium transients of cardiac tissues at different time points in culture demonstrating maximum amplitude at 14 days. (d) 3D segmented and color-coded Z-stack of nuclei reveal high cell density throughout the tissue, including in (e) longitudinal and (f) transverse cross sections. Scale bars are 20 μm. (g) Fluorescent image showing uniaxial alignment of sarcomeres with high cell density. Scale bar is 10 μm. (H) High magnification imaging of cardiomyocytes show alignment along length of tissue and (i) well-organized sarcomeric structures. Tissues are stained for nuclei (blue), a-actinin (green), and F-actin (red.) Scale bars are 20 μm for (h) and 5 μm for (i).

