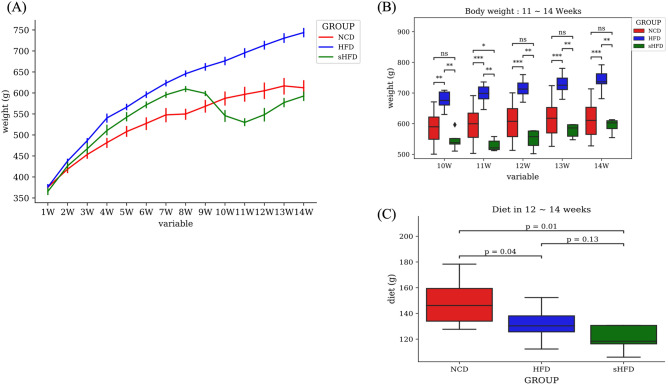
Figure 1.
Changes in the body weight and diet intake of rats in the NCD, HFD, and sHFD groups. (A) Body weight in each group over a duration of 14 weeks. The blue solid line indicates the high-fat diet (HFD) group. The green and red solid lines indicate the HDF-induced obesity group that underwent gastrectomy (sHFD) and the group fed a normal chow diet (NCD), respectively. NCD: Normal chow diet group, HFD: High fat diet group, sHFD: after high fat diet, gastrectomy group. (B) A bar plot showing the body weight of each group from the time of gastrectomy (weeks 10–14). The asterisk (*) represents the p-value of the comparative statistical test for each bacterial genera frequency (* < 0.05; ** < 0.01; *** < 0.001). (C) Box plot showing the diet intake (g) during weeks 12–14.

