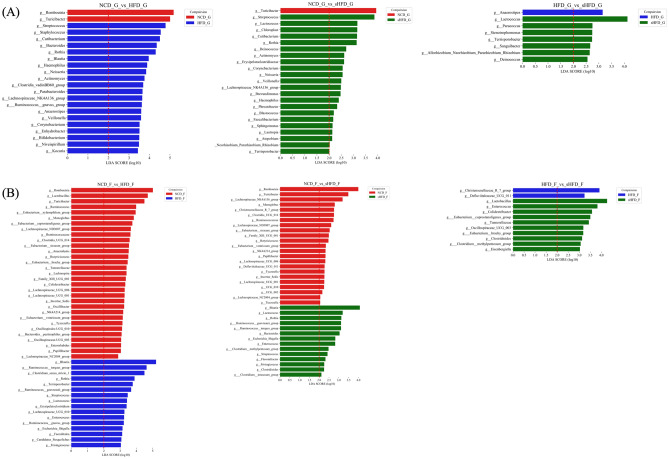
Figure 4.
Impacts of the NCD, HFD, and sHFD treatments on the composition of gastric and fecal microbiota. LEfSe analysis of the gastric- and fecal-derived microbiota in each group. For each comparison, genera with LDA scores > 2.0 are shown. Results for NCD vs. HFD, NCD vs. sHFD, and HFD vs. sHFD are shown for (A) gastric and (B) fecal samples. NCD: Normal chow diet group, HFD: High fat diet group, sHFD: after high fat diet, gastrectomy group.

