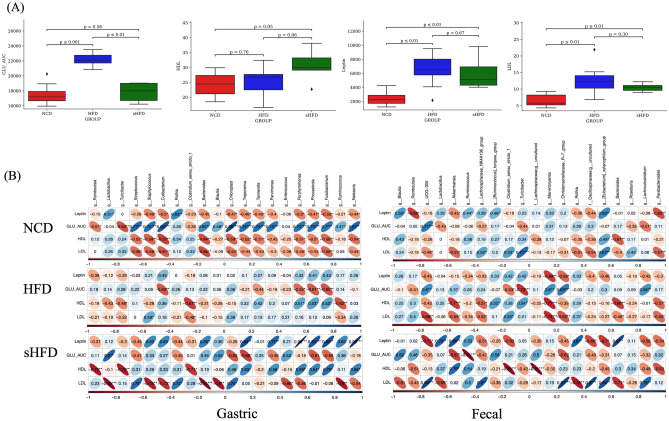
Figure 5.
Correlation analysis between clinical parameters that were significantly different between groups (p < 0.05) and gut/fecal microbiome composition. (A) Bar plots showing significant differences in clinical parameters between groups. (B) Correlation matrix showing correlations between clinical parameters and the abundances of microbes. The size and color intensity of the ellipses indicate the strength of positive or negative correlation (blue color, positive correlation; red color, negative correlation). The black asterisk (* < 0.05; ** < 0.01; *** < 0.001) within the ellipses represents the p-value of the statistical test. NCD: Normal chow diet group, HFD: High fat diet group, sHFD: after high fat diet, gastrectomy group.

