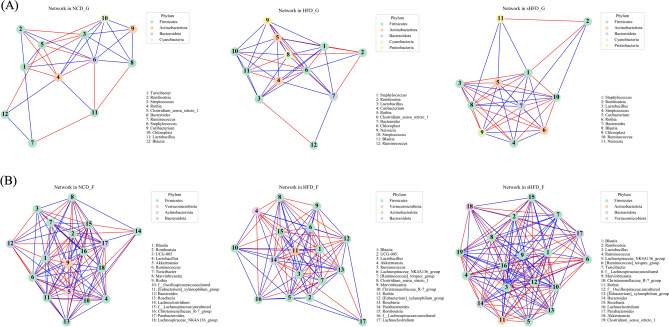
Figure 6.
Co-occurrence networks of the top 20 microbial genera in the gastric and fecal samples of the NCD, HFD, and sHFD groups. The top 20 genera were identified based on SparCC values. Co-occurrence networks are shown for (A) gastric and (B) fecal samples. The nodes represent the microbial genera, and the line colors indicate negative (red) or positive (blue) correlation. NCD_G: Gastric derived microbiota in normal chow diet group, HFD_G: Gastric derived microbiota in high-fat diet group, sHFD_G: Gastric derived microbiota in HFD-induced obese rats that underwent sleeve gastrectomy group. NCD_F: Fecal derived microbiota in normal chow diet group, HFD_F: Fecal derived microbiota in high-fat diet group, sHFD_F: Fecal derived microbiota in HFD-induced obese rats that underwent sleeve gastrectomy group.

