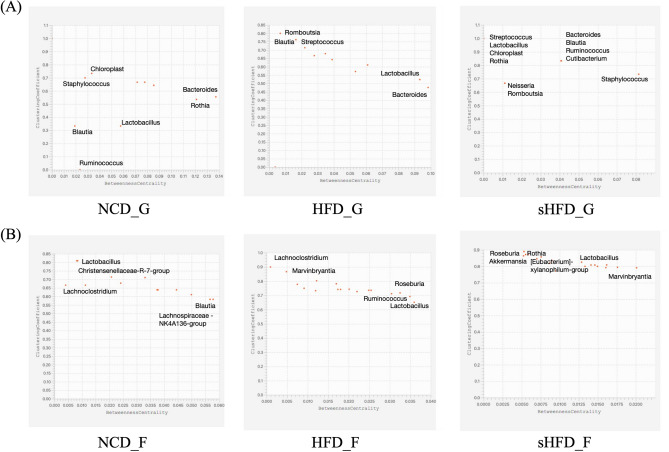
Figure 7.
Co-occurrence between microbes based on betweenness centrality (BNC) and clustering coefficient (CC). Each plot shows the intersection between BNC and CC values. Only most prominent genera of bacteria are included. The X-axis is BNC (Betweenness Centrality) and the Y-axis is CC (Clustering Coefficient). Microbial genera located at the bottom right of the plot have the lowest co-occurrence rates compared to other genera (low CC), meaning they are at the center of the network topology (high BNC).

