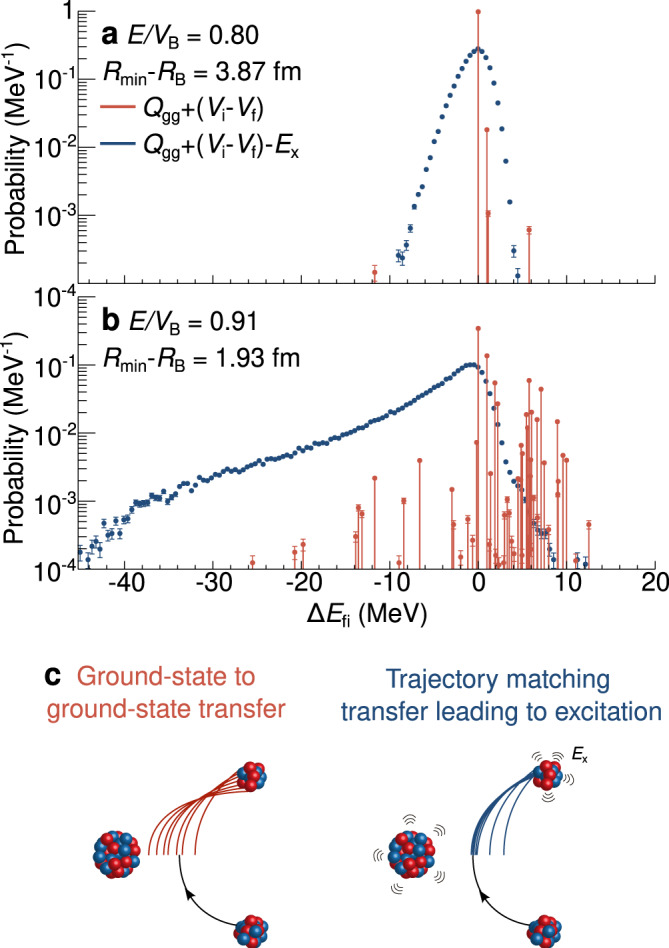
Fig. 2. Quantifying the change in available and kinetic energies.

The change in available energy ΔEgg (red) and in kinetic energy ΔEfi (blue) is shown for all transfer channels at (a) E/VB = 0.80 ( fm) and (b) E/VB = 0.91 ( fm). Cases for all other measured energies are shown in Supplementary Fig. 3. Statistical errors are shown. The red lines show ΔEgg, the maximum extra energy available to the colliding nuclei following transfer, which comprises kinetic and excitation energy. After subtracting the excitation energy, the blue curves show ΔEfi, the distribution of kinetic energies following transfer with respect to their potential. c Illustration showing how ground-state to ground-state transfers (red) result in discontinuities in the trajectories resulting from the change in potential after transfer. The reflected flux clustering to zero change in energy when the excitation energy is included (blue) is due to transfers preferentially producing excitation energies Ex that ensure a smooth match between entrance and exit channels.
