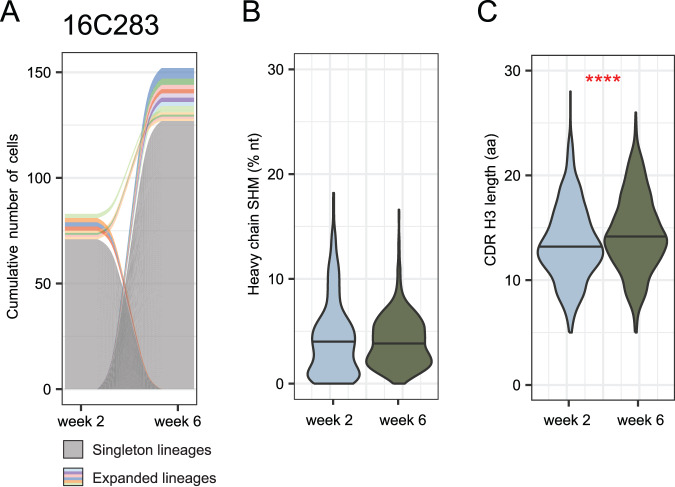
Fig. 2. Antigen-specific B cell repertoire of vaccinated animals.
A Representative alluvial plot from B cell clonal dynamics from one animal. Gray lines represent singleton B cells and colored lines represent expanded lineages. Lines that start or end at zero, including all singletons, indicate B cell lineages that were observed in only a single time point. Colored lines that span the graph represent lineages found at both time points. The thickness of each line at either side of the panel is proportional to the number of cells in that lineage at the corresponding time point, with the cumulative number of cells in all lineages indicated on the y-axis. N = 83 cells from week 2 and 152 cells from week 6. Similar plots for other animals may be found in Fig. S2. B Heavy chain somatic hypermutation (SHM) of all antigen-specific memory B cells from eight animals. N = 696 cells at week 2 and 1393 cells at week 6. Distributions were compared using 2-sided unpaired Wilcoxon test. Distributions for individual animals may be found in Fig. S3a. Distributions considering only one cell per lineage may be found in Figs S3b and S3c. C CDR H3 length in amino acids (aa) of antigen-specific memory B cells from 8 animals. Because CDR H3 length is essentially invariant within a lineage, only one cell per lineage was included. N = 641 lineages at week 2 and 1238 lineages at week 6. Distributions were compared using a 2-sided unpaired Wilcoxon test, P = 1.2E-7. Distributions for individual animals may be found in Fig. S4a. Distributions considering all cells may be found in Figs. S4b and S4c. Source data are provided as a Source Data file.

