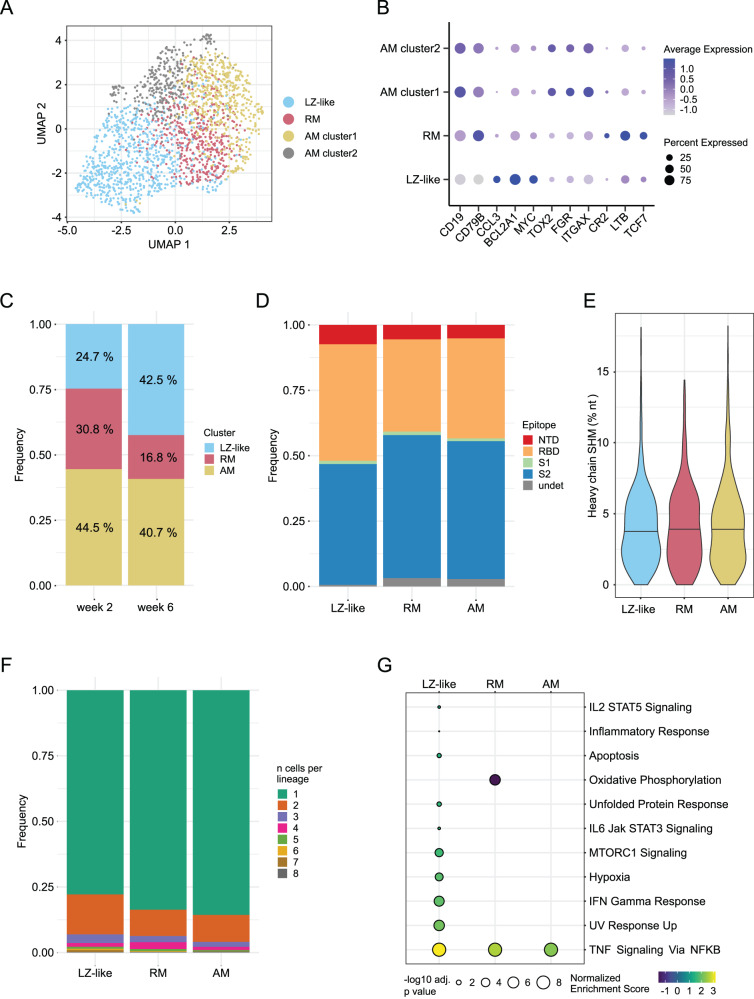
Fig. 4. B cell transcriptomics reveal a subset of highly activated cells that recently exited germinal centers.
A UMAP plot showing clusters based on gene expression from antigen-specific B cells. The clusters correspond to Light zone (LZ)-like cells, resting memory (RM) cells, and two activated memory (AM) clusters as shown in (B). B Differentially expressed genes that define the phenotype of each cluster identified in (A). Both AM clusters have identical functional markers and were combined for downstream analysis. C Frequencies of each cluster identified in (A) at each time point. D Epitope targeting as delineated by flow cytometry for each phenotypic cluster. E Heavy chain somatic hypermutation (SHM) for each cluster; no significant differences were found using a one-way ANOVA test. F Clonal expansion frequency for each cluster. G Gene set enrichment analysis comparing week 6 to week 2 for each cluster, using the Hallmark gene sets from MSigDB (34). A Kolmogorov-Smrinov test with the Benjamini–Hochberg correction for multiple testing was used to identify pathways with significant changes. Only pathways with at least one significant result are shown. A total of 2034 antigen-specific B cells sorted from 8 animals at weeks 2 and 6 were analyzed. Source data are provided as a Source Data file.

