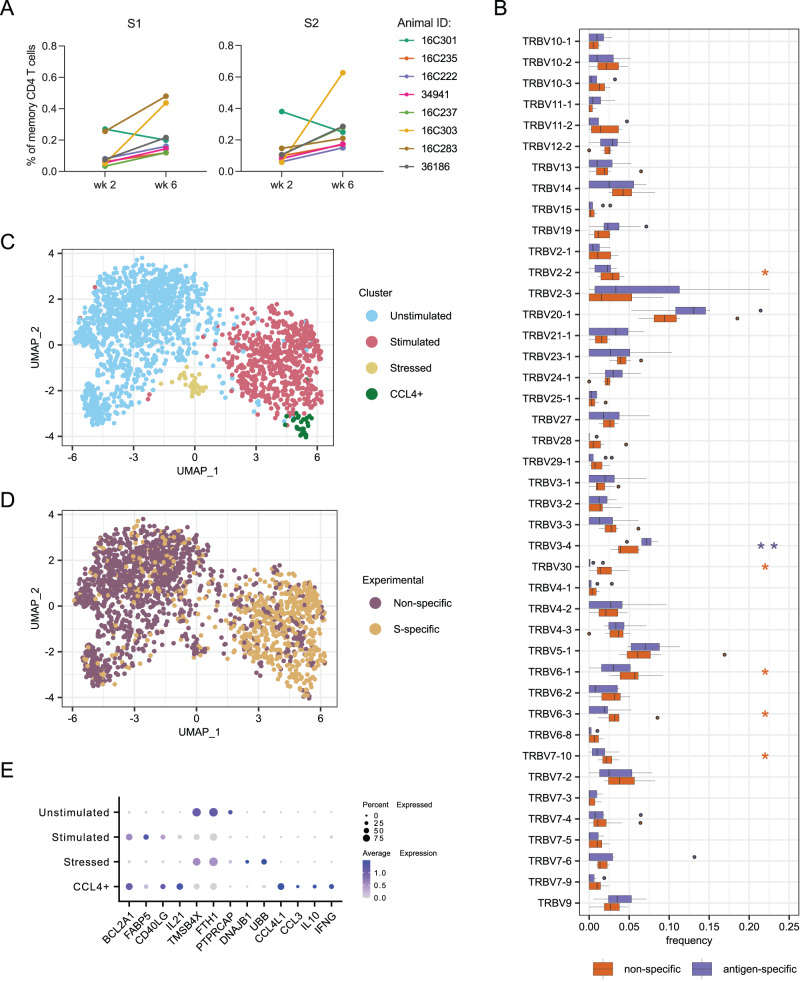
Fig. 5. T cell responses induced by vaccination.
A Frequencies of activated memory CD4 T cells after stimulation with peptide pools from S1 and S2 domains of SARS-CoV-2 spike. B Comparison of TRBV gene usage between non-specific and S-specific memory CD4 T cells sorted. Boxes show the interquartile range, with the median marked as heavy horizontal band. Whisker represent the highest (lowest) datapoint within 1.5 times the interquartile range of the 75th (25th) percentile. Genes with statistically significant difference by a 2-sided paired Wilcoxon test are indicated with asterisks in the color of the up-regulated group. P = 0.0391, 0.0078, 0.0225, 0.0391, 0.0391, and 0.0391 for TRBV2-2, TRBV3-4, TRBV30, TRBV6-1, TRBV6-3, and TRBV7-10, respectively. C UMAP plot identifying four phenotypic clusters based on gene expression. D UMAP plot colored by experimental conditions identifying S-specific and non-specific T cell by sort. These correspond closely to the phenotypic clusters defined in (C). E Differentially expressed genes that define the phenotype of each cluster identified in (C). A total of 664 S-specific and 1259 non-specific T cells sorted from 8 animals at weeks 2 and 6 were analyzed for all panels. Source data are provided as a Source Data file.

