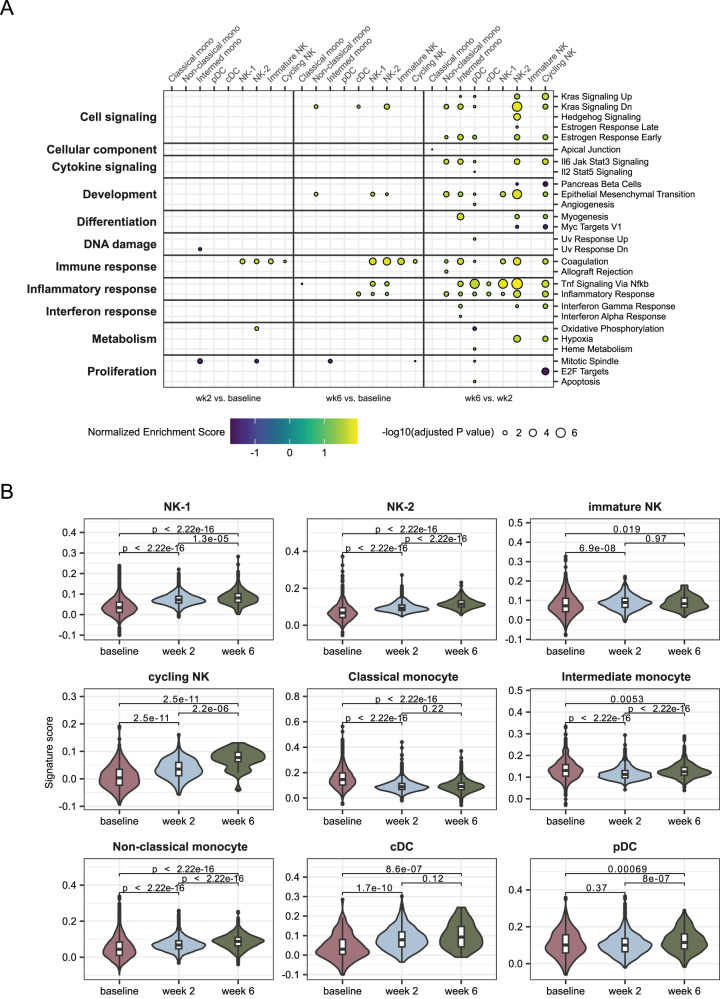
Fig. 8. Upregulation of inflammatory pathways after second dose.
A Gene set enrichment analysis using Hallmark pathways from MSigDB (34). A Kolmogorov-Smrinov test with the Benjamini-Hochberg correction for multiple testing was used to identify pathways with significant changes. Only pathways with at least one significant result are shown. Left panel, week 2 compared to baseline. Middle panel, week 6 compared to baseline. Right panel, week 6 compared to week 2. Within each panel, each column represents one of the transcriptional clusters identified in Fig. 6a. GSEA of sorted innate cells compared between different time points. B Signature score indicating the expression levels of 50 genes identified as being predictive of the magnitude of antibody responses to vaccines (21). Signature scores were calculated using the ModuleScore function in Seurat. Boxes show the interquartile range, with the median marked as heavy horizontal band. Whisker represents the highest (lowest) datapoint within 1.5 times the interquartile range of the 75th (25th) percentile. A total of 30,671 cells from the baseline, 23,073 cells from week 2, and 7307 cells from week 6 were analyzed. P values were obtained using a two-sided unpaired Wilcoxon test with Holm correction for multiple testing. Mono monocyte, NK natural killer, pDC plasmacytoid dendritic cell, cDC classical dendritic cell. Source data are provided as a Source Data file.

