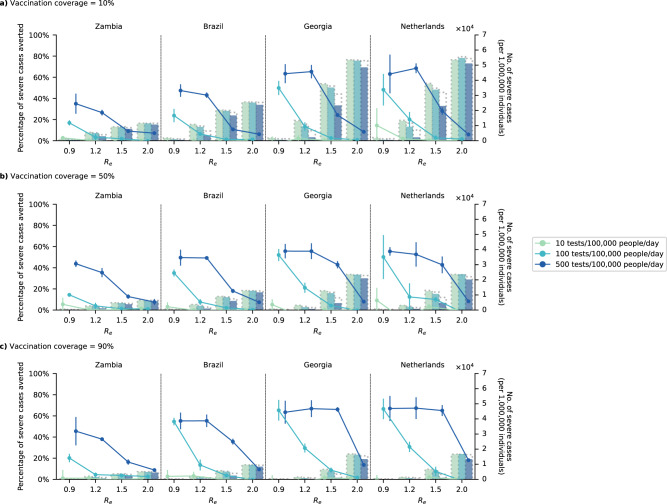
Fig. 2. Impact of test-and-treat on severe cases.
No restrictions on access to symptomatic testing at clinics (i.e., all symptomatic individuals who sought testing at clinics would receive one if in stock) and high-risk household contacts of test-positive individuals are not tested. All eligible high-risk individuals (i.e., ≥60 years of age or an adult ≥18 years with a relevant comorbidity) who tested positive were given a course of oral antivirals. Line plots (left axis) show the mean percentage change (standard deviation denoted by error bars; n = 5 independent simulations) in severe cases relative to no distribution of antivirals under different levels of mean test availability (different shades of color) after a 90-day epidemic wave in a population of 1,000,000 individuals with a 10%, b 50%, and c 90% vaccination coverage for different epidemic intensities (measured by the initial effective reproduction number (Re); x axis). Bar plots (right y axis) show the number of severe cases in each corresponding scenario. The dotted outline of each bar shows the number of severe cases of each scenario when no antivirals were distributed.

