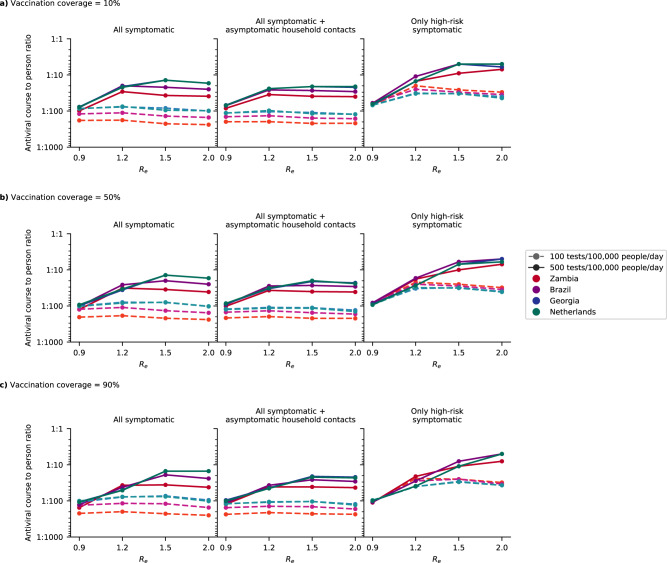
Fig. 4. Estimated need of oral antivirals.
Line plots show the ratio of estimated oral antiviral courses needed to number of people per year (expressed as 1 oral antiviral course per n number of individuals; assuming two epidemic waves a year) in simulated countries (color) under different simulated scenarios (i.e., testing rate at 100 or 500 tests/100,000 people/day (shading and linestyle) and distribution modality (left plot panel: test all symptomatic individuals who sought testing at clinics; middle plot panel: test all symptomatic individuals who sought testing as well as distributing clinic-provided self-tests to high-risk asymptomatic household contacts of test-positive individuals; right plot panel: test only high-risk symptomatic individuals who sought testing at clinics). All test-positive eligible high-risk individuals from clinic-provided testing would receive a course of oral antivirals. a 10%, b 50%, and c 90% vaccination coverage assumed for the simulated population.

