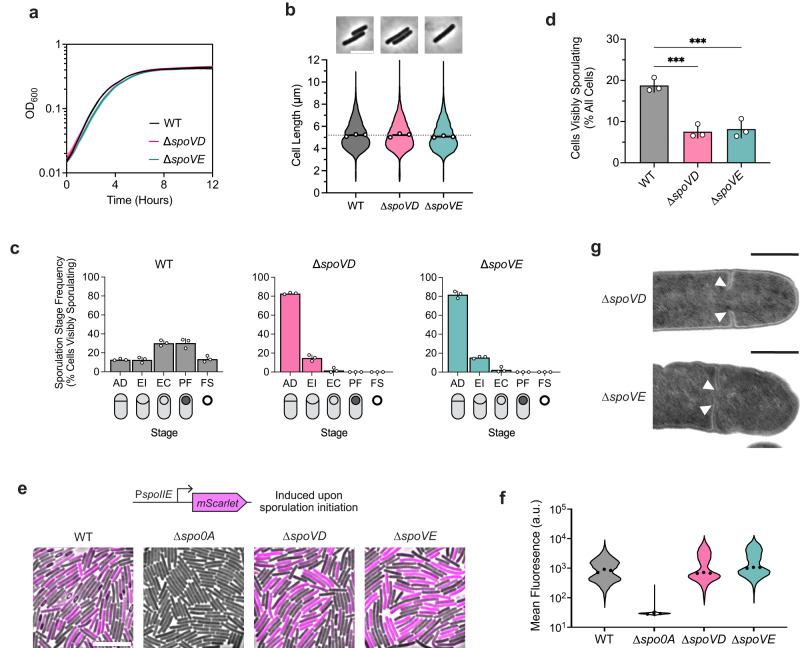
Fig. 2. The sporulation-specific PG synthases, SpoVD and SpoVE, are important for asymmetric, but not vegetative, division.
a Growth profiles of C. difficile wildtype (WT), ∆spoVD, and ∆spoVE strains in BHIS. Data are from a single experiment; mean and standard deviation curves are plotted from three biological replicates. b Violin plots showing length distributions and representative micrographs of cells sampled from BHIS cultures during mid-exponential growth (OD600 ~0.5). White circles indicate means from each replicate; black lines indicate average means; dotted line indicates the WT average mean for comparison across strains. Data from three biological replicates; >1500 cells per sample. Scale bar, 5 µm. c, d Cytological profiling of cells sampled from sporulation-inducing plates after 18–20 h of growth. Cells were assigned to five distinct stages based on their membrane (FM4-64) and DNA (Hoechst) staining and phase-contrast morphological phenotypes. For representative micrographs and stage assignment information, see Supplementary Fig. 5a. AD Asymmetric Division, EI Engulfment Initiated, EC Engulfment Completed, PF Phase bright/dark Forespore, FS Free Spore. White circles indicate means from each replicate, bars indicate average means and error bars indicate standard deviation. ***p<0.001; statistical significance was determined using ordinary one-way ANOVA with Dunnett’s test. Data from three independent experiments; >1000 total cells and >100 visibly sporulating cells per sample. Source data with exact P values are provided in the Source Data file. e Representative merged phase-contrast and fluorescence micrographs visualizing PspoIIE::mScarlet transcriptional reporters in sporulating cells sampled from 70:30 plates after 14–16 h of growth. PspoIIE is induced upon sporulation initiation. The ∆spo0A strain serves as a negative control because it does not initiate sporulation. Scale bar, 10 µm. f Violin plots showing quantified mean fluorescence intensities of strains shown in e. Black dots represent median values from each replicate. Data from three independent experiments; >3000 cells per sample. g Transmission electron micrographs of ∆spoVD and ∆spoVE sporulating cells that fail to complete septum formation 24 h after sporulation induction (white arrows). Scale bars, 500 nm. >50 sporulating cells were analyzed per strain from two independent experiments for WT and ∆spoVD and one experiment for ∆spoVE.

