
Figure 6. Hydrogen exchange of WT human γS-crystallin and N14D and N76D variants measured by NMR.
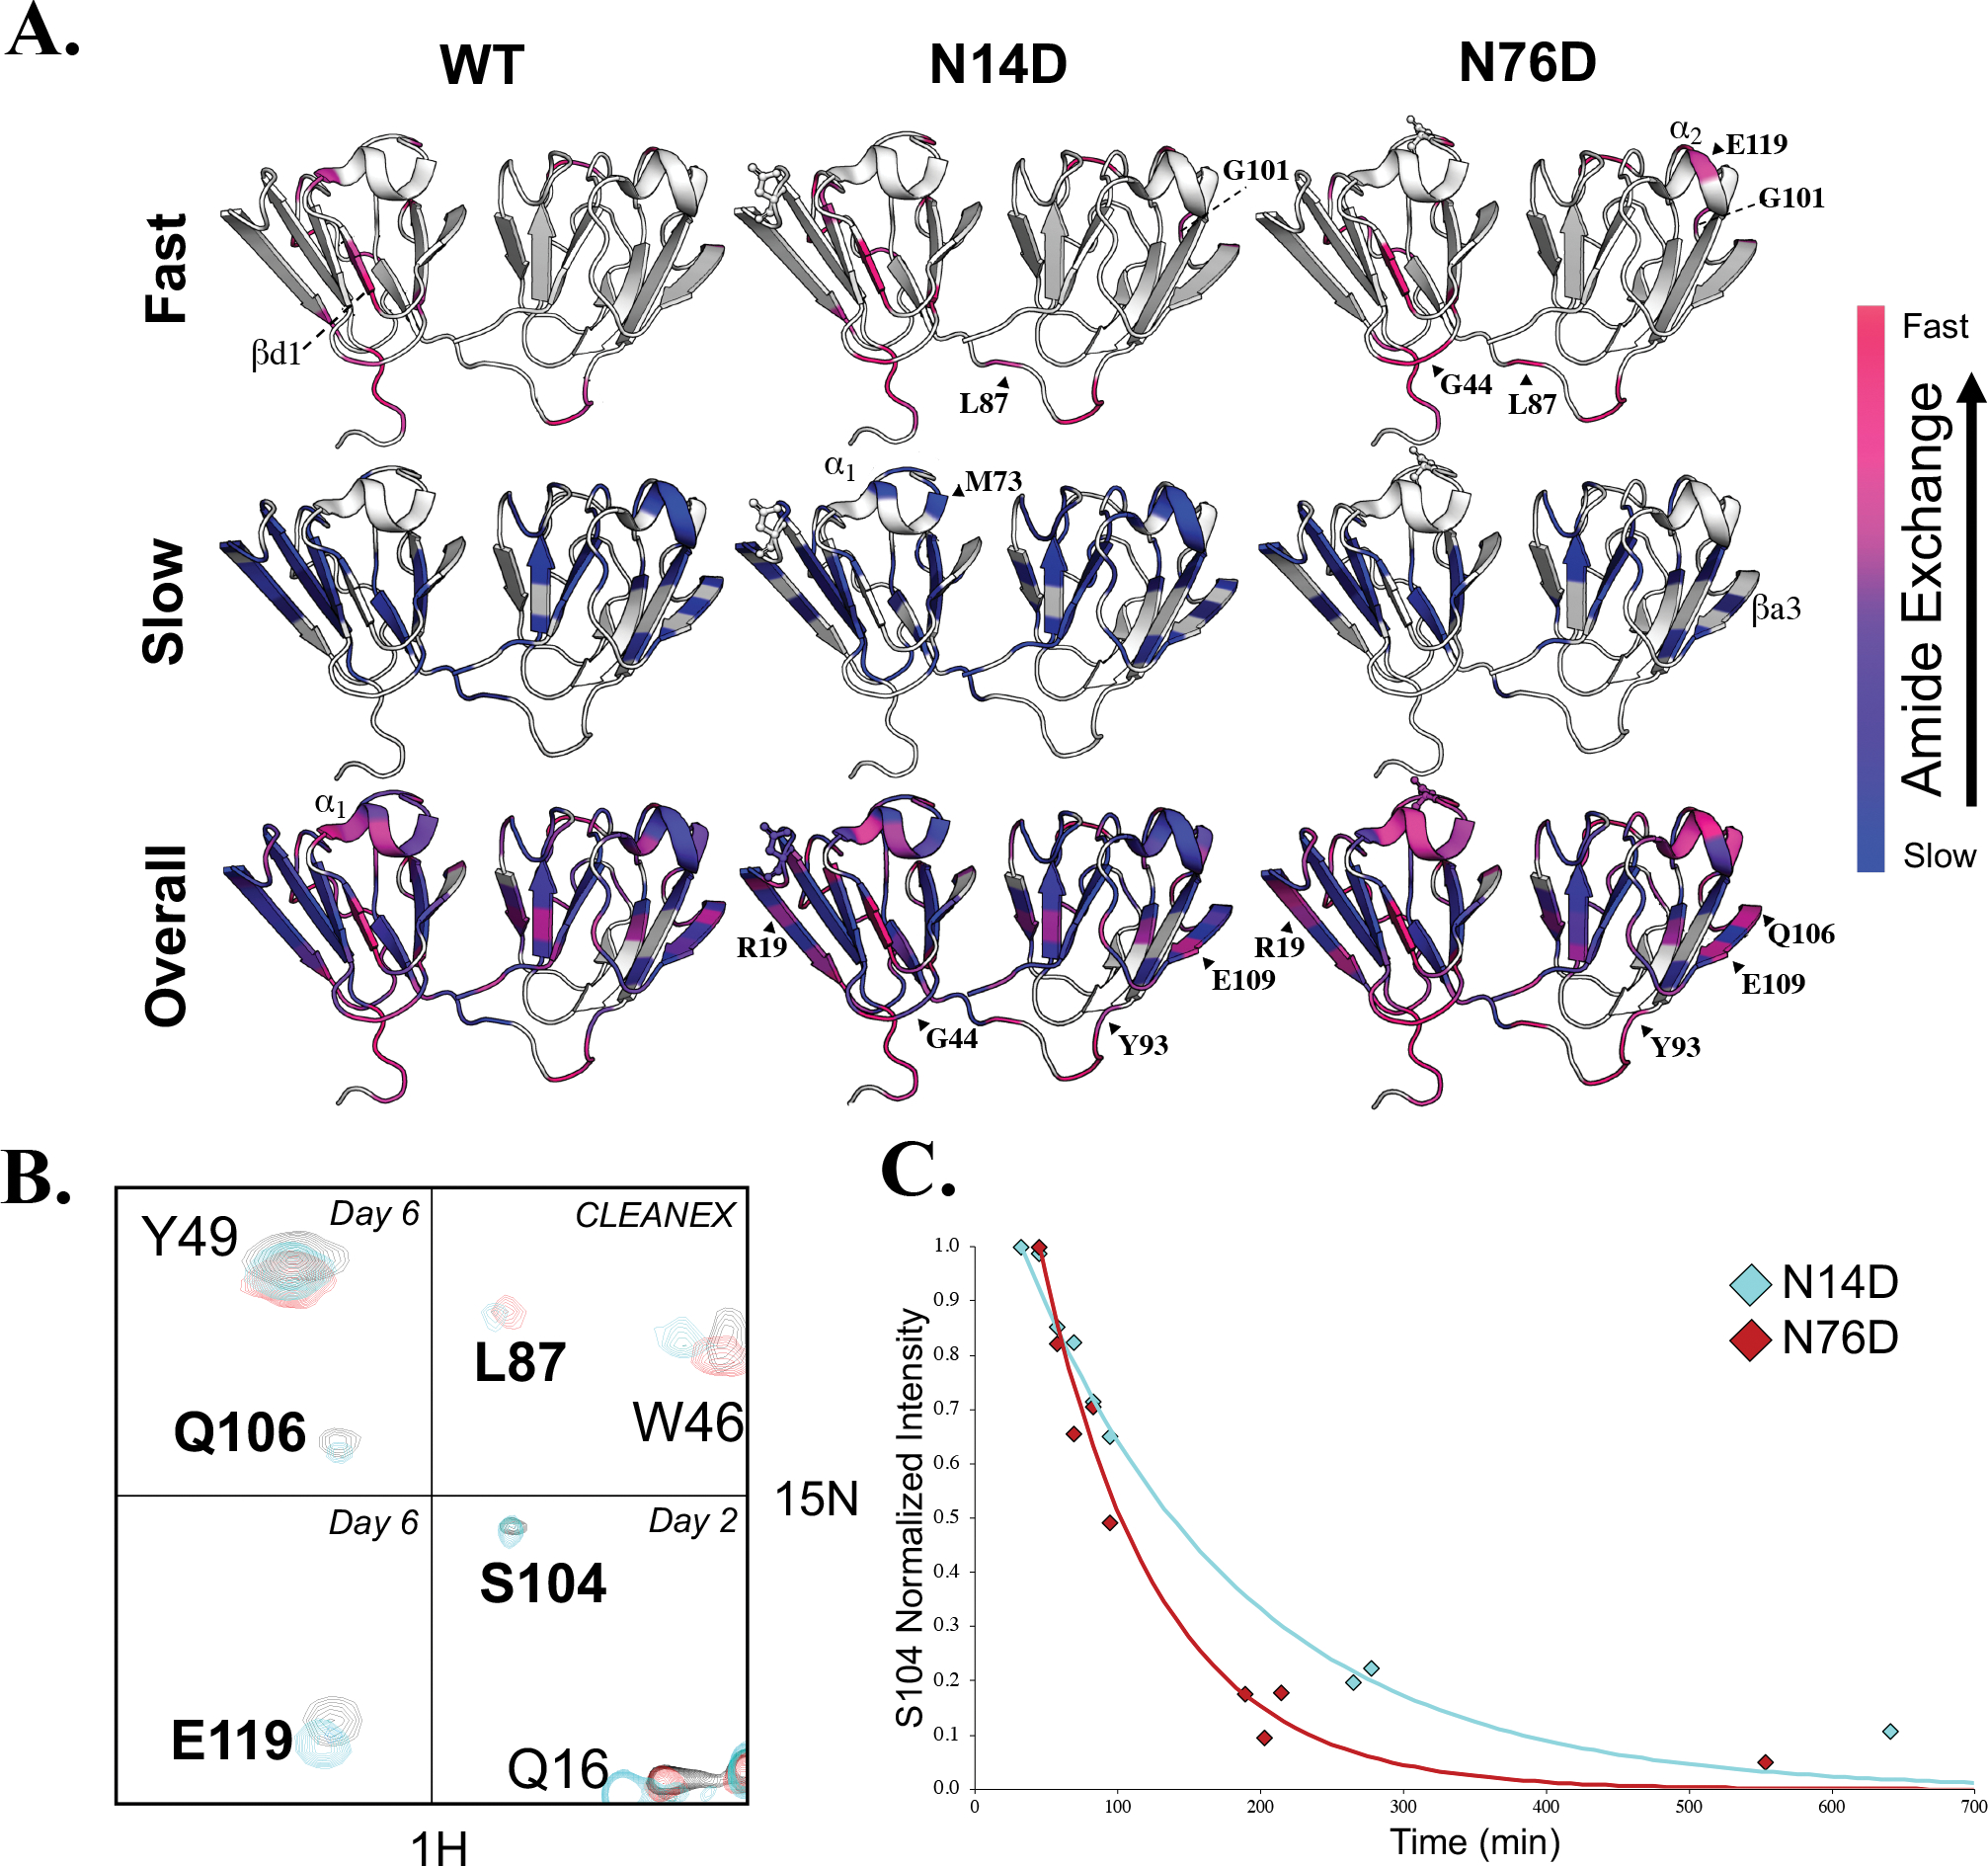
(A, Top) H/H exchange of WT (left), N14D (middle), and N76D (right) showed altered solvent accessibility compared to WT. High intensity peaks that appeared in CLEANEX spectra for amide protons that exchanged the fastest are mapped on the structure in hotpink and lower intensity CLEANEX peaks are mapped in magenta. (A, Middle) H/D exchange showing the slowest, core residues mapped in blue whose intensity did not significantly change after fourteen days in D2O. (A, Bottom) Intermediate exchange rates with purple denoting residues that exchanged before the first Best-TROSY spectrum was obtained (in D2O for ~30min) but weren’t visible in CLEANEX, followed by residues that exchanged after 1 day in D2O (pink), after 2–3 days (magenta-purple), and after 6 days in D2O (dark purple). Those residues that did not have NMR peak assignments available or that were too broad to confidently measure their exchange rates, were mapped on the structure in white. (B) NMR spectral overlay of WT (black), N14D (cyan) and N76D (red). Residues which showed significantly altered H/D exchange compared to WT were in bold. Day 6 H/D exchange spectra of Q106 and Y49 (top left), day 6 H/D exchange spectra of E119 (bottom left), CLEANEX spectra of L87 and W46 (top right), and day 2 H/D exchange spectra of S104, Q16, and R145 (bottom right). (C) H/D exchange rates of S104 are different for N14D (cyan) and N76D (red) and are reported in Table S1.