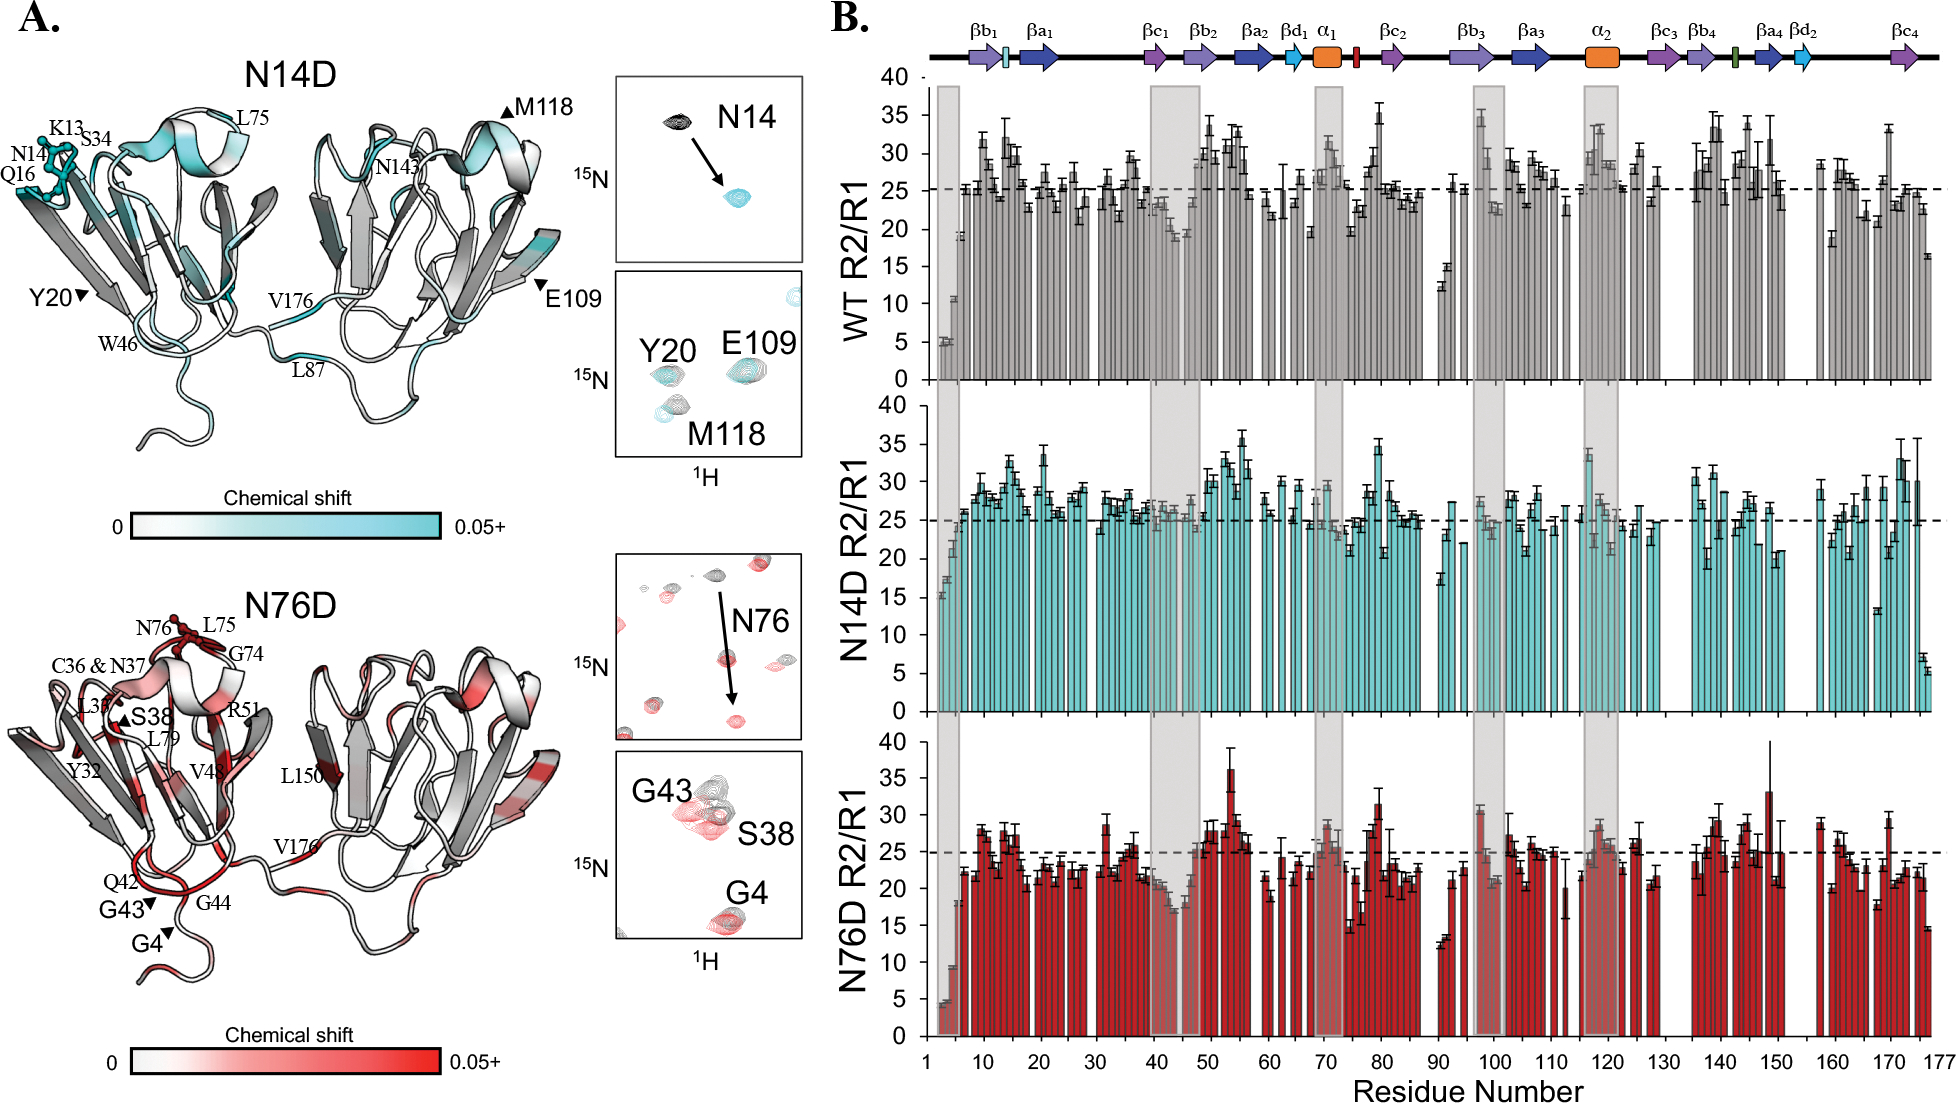
Figure 7. 1H-15N chemical shifts and R2/R1 values for WT, N14D, and N76D.

(A) Chemical shift differences mapped on the structure in N14D (top) and N76D (bottom). Shifts shown range from 0.02–0.8 to 0.02–0.15 ppm for N14D and N76D, respectively, and are colored on the structure here from 0–0.5 ppm to distinguish small changes. Full mutant spectra overlaid with WT are shown in Fig. S4. (B) R2/R1 plots of WT (grey), N14D (cyan), and N76D (red). Boxes highlight key differences. The dotted line was placed at the WT average of 25 for comparison.
