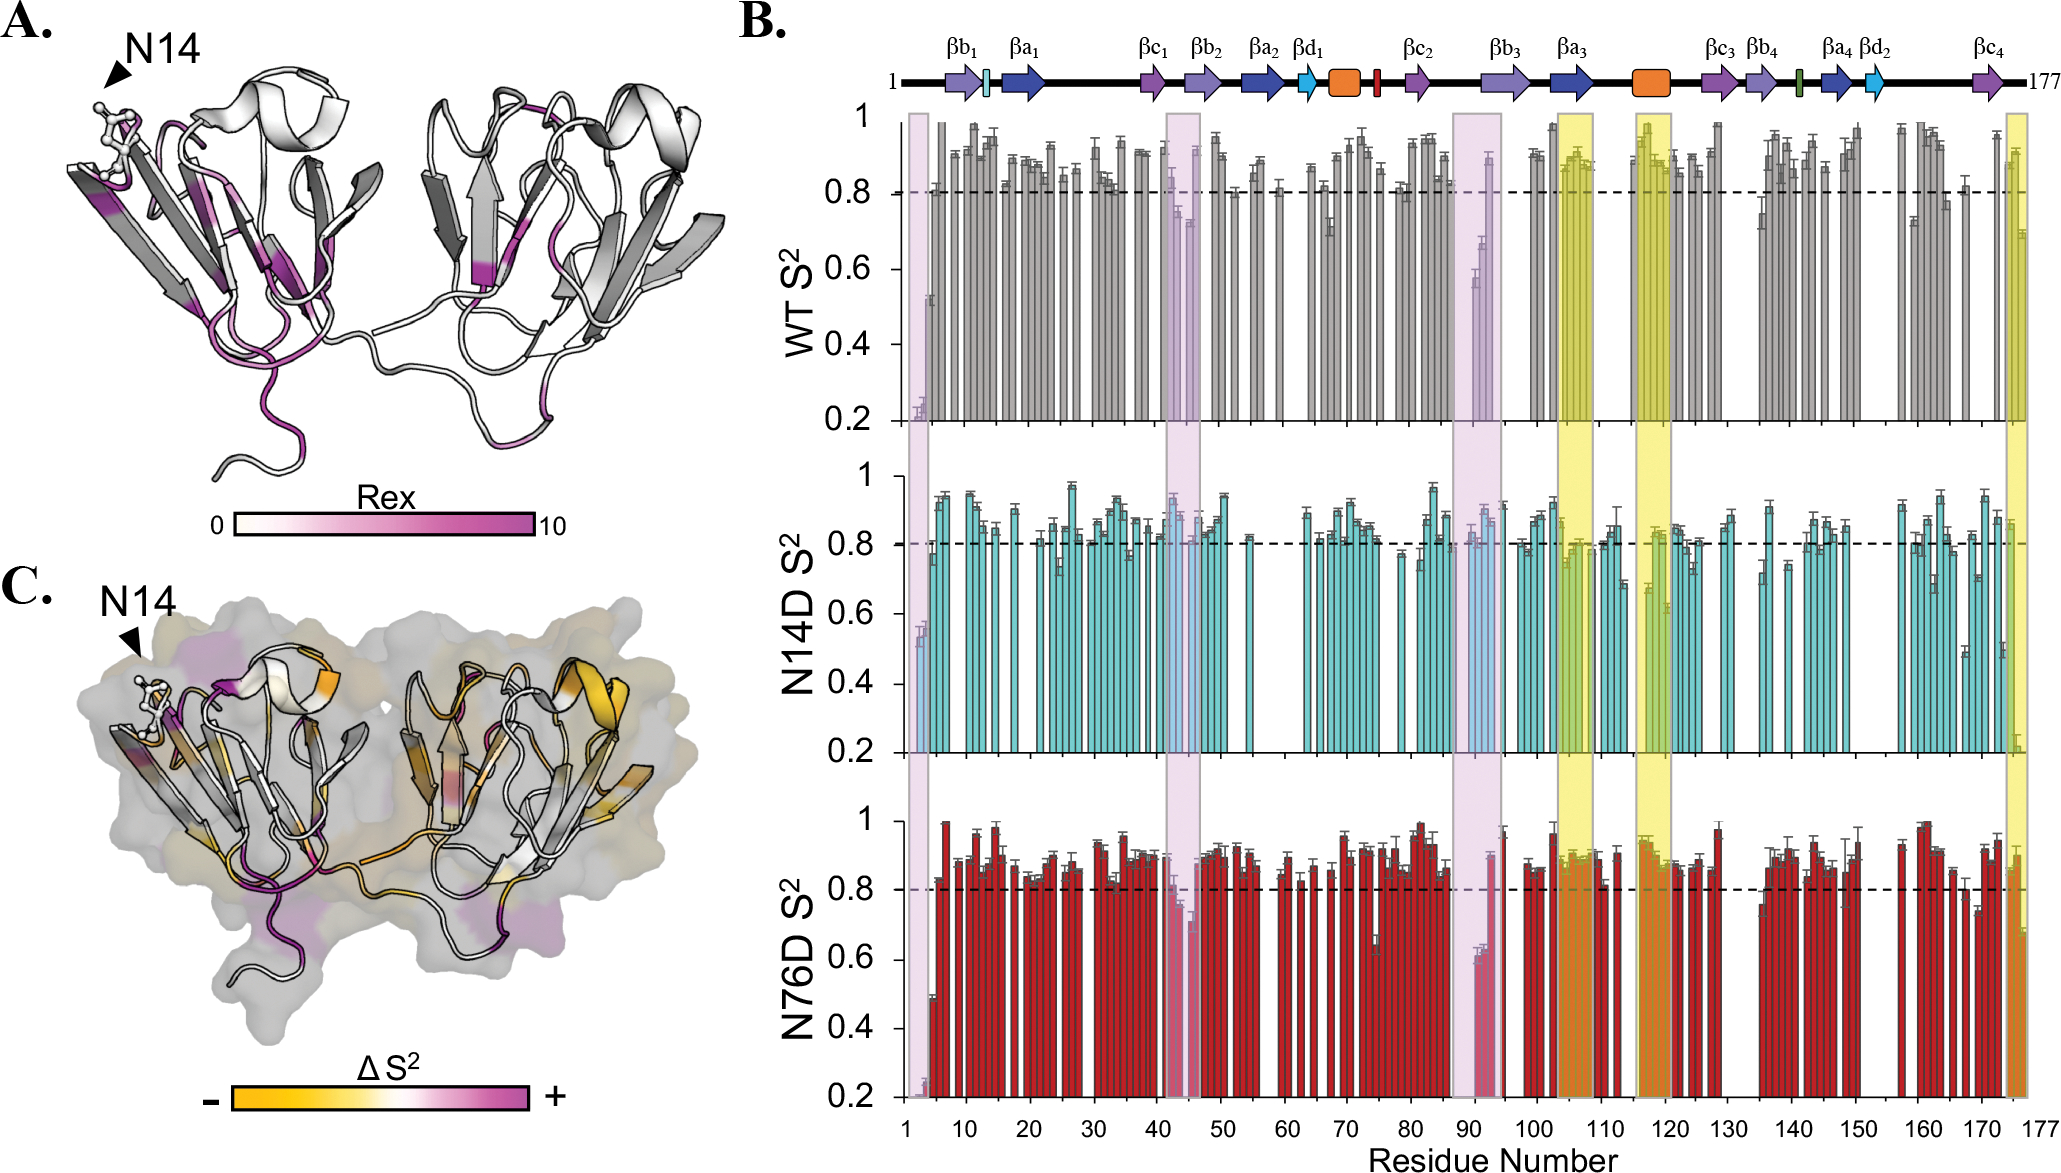
Figure 8. FastModelFree analysis of N14D and N76D.

(A) N14D Rex values ranging from 0.38–9.01 were mapped on the 3D structure from light to bright magenta. Residues colored white have no Rex values determined from the model. (B) S2 plots of WT (grey), N14D (cyan), and N76D (red). Boxes highlight a decrease (yellow) or increase (purple) in S2 in N14D. The dotted line at 0.8 was provided for comparison. Few significant differences were observed for N76D at this timescale. (C) Changes in S2 for N14D were colored by residue onto the structure as a decrease (yellow) or increase in S2 (magenta).
