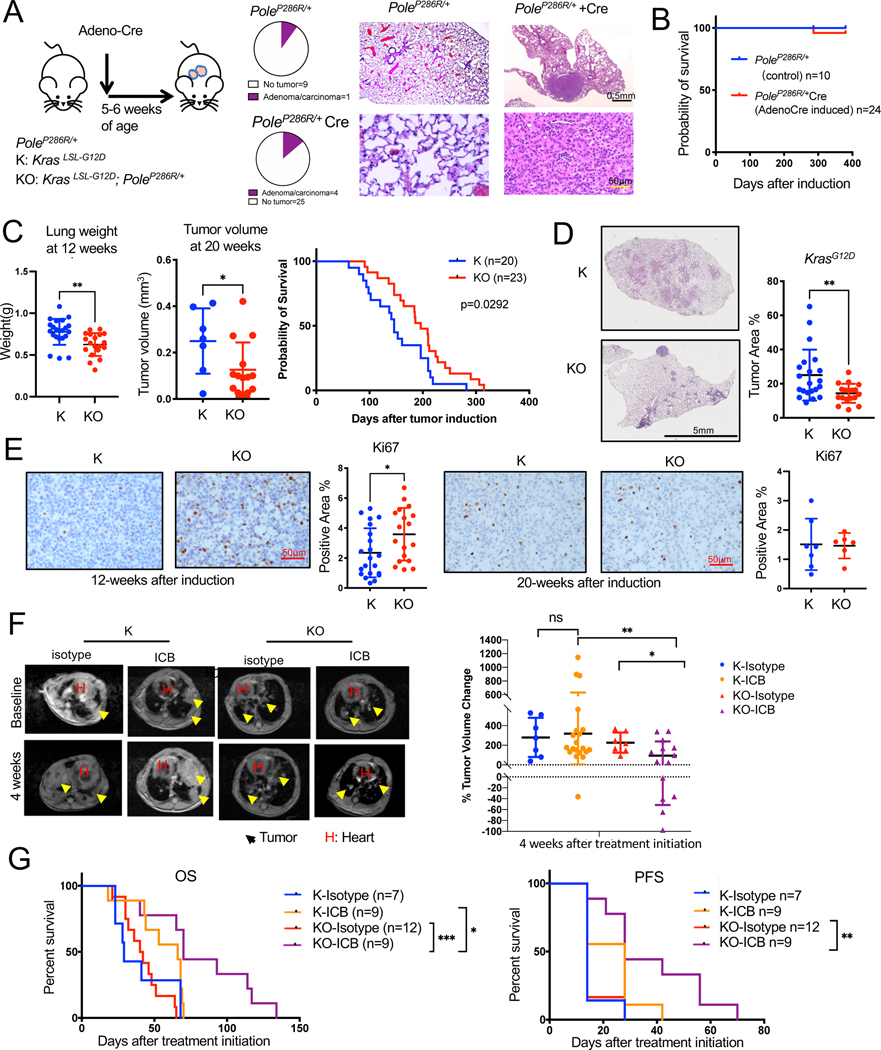
Figure 1. PoleP286R is not a driver of lung tumor initiation by itself but addition of PoleP286R to KrasG12D/+ increases their TMB.
(A) Schema for GEMM tumor induction by intranasal Adeno-Cre. Pie chart showing incidence of tumors in the lung of uninduced PoleLSL-P286R/+ control and induced PoleP286R/+ mice. Representative H&E staining of tumor free lung and a tumor in the lung of uninduced PoleLSL-P286R/+ control and induced PoleP286R/+ mice. Control n=10, induced n=29.
(B) Survival curves for PoleLSL-P286R/+ control and induced PoleP286R/+ animals analyzed by Log-rank test. All animals except for the one that died were euthanatized at ~70 weeks for observation of tumors in the lungs. Control n=10, induced n=24.
(C) Tumor progression of K and KO GEMMs was measured by lung weight (left) and MRI (middle) at 12 (n=22 for K, n=19 for KO) and 20 weeks (n=7 for K, n=14 for KO) respectively (Unpaired t-test, Error bar: SD). 12-week tumors were not always detectable my MRI. Survival curves for K/KO mice are on the right (n=20 for K, n=23 for KO, Log-rank test). Mice were recorded as dead when they either died or reached euthanasia point.
(D) Representative H&E-stained lung sections of K and KO GEMMs (12-week: n=21 for K, n=18 for KO. Unpaired t-test was utilized. Error bar: standard deviation (SD)). Tumor area is quantified on the right.
(E) Ki67 immunohistochemistry (IHC) on K and KO GEMM lung tissues (12-week: n=21 for K, n=18 for KO. 20-week: n=7 for K, n=6 for KO, Unpaired t-test. Error bar: SD). Representative images (left) and quantification of staining (right) shown.
(F) Combination of PD-L1 and CTLA-4 antibodies immune checkpoint blockade (ICB) treatment of K and KO GEMMs. Representative MRI images (left) and quantification of lung tumors at 4 weeks after treatment initiation (right). Yellow arrows point to tumors. H: heart. N=8 for K-isotype, n=12 for K-ICB, n=7 for KO-isotype, n=14 for KO-ICB. Unpaired t-test. Error bar: SD.
(G) Overall survival (OS) and progression-free survival (PFS) of K/KO mice under isotype or ICB treatment analyzed by Log-rank test. Progression is defined by the timepoint when tumor volume increases more than 20% of baseline tumor volume. N=7 for K-isotype, n=9 for K-ICB, n=12 for KO-isotype, n=9 for KO-ICB. Log-rank test. For all figures, *: p<0.05, **: p<0.01, ***: p<0.001, ****: p<0.0001.
Also see Figure S1.

