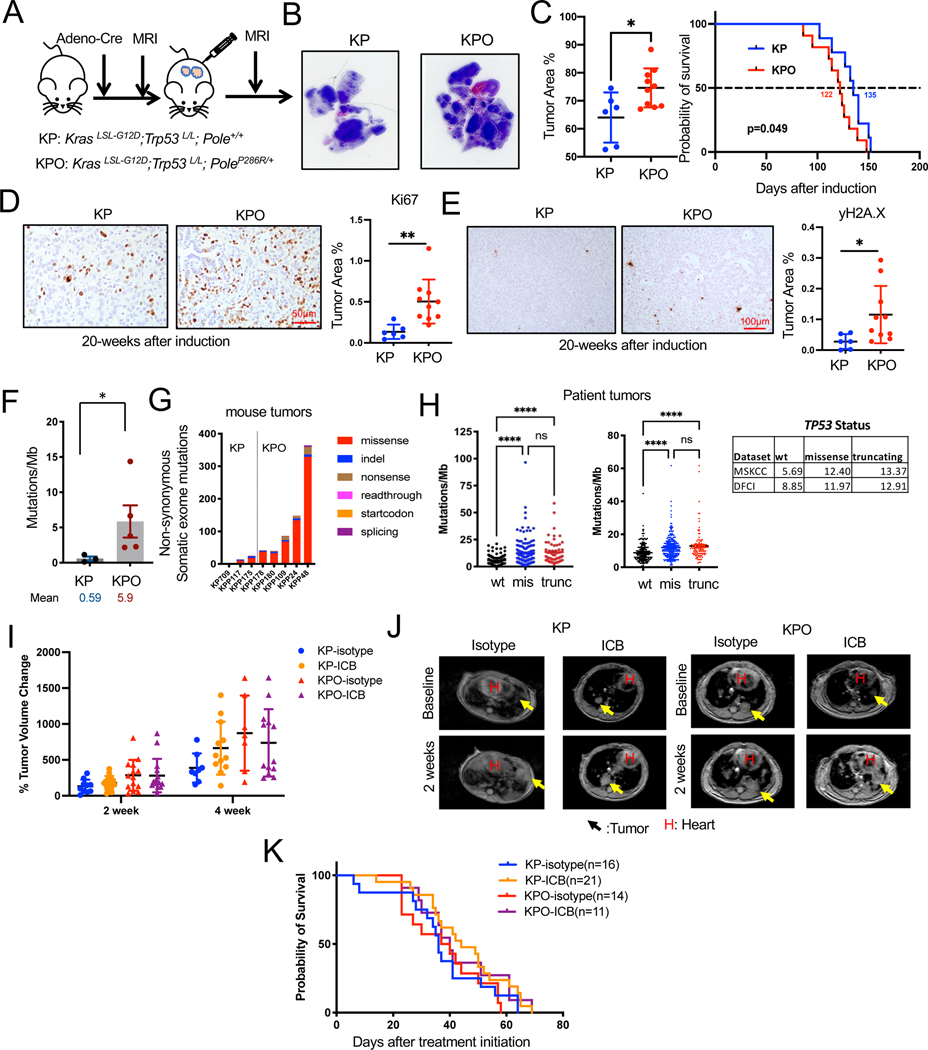
Figure 2. Addition of PoleP286R accelerated the progression of KrasG12D/+;p53−/− tumors.
(A) Schema for GEMM tumor induction by intranasal Adeno-Cre.
(B) Representative H&E stains of lungs from KP and KPO GEMMs with tumor area quantification as % of normal area quantified on the right. N=6 for KP, n=10 for KPO, Unpaired t-test, Error bar: SD.
(C) Survival of KP and KPO GEMMs after tumor induction. N=9 for KP, n=11 for KPO, Log-rank test.
(D) Ki67 IHC on KP and KPO GEMM lung tissues. Representative image is shown on the left and stained area is quantified on the right. N=6 for KP, n=10 for KPO. Statistical test: Unpaired t-test, Error bar: SD.
(E) γH2AX IHC on KP and KPO GEMM lung tissues. Representative images are shown on the left and quantification of stained area is shown on the right. N=6 for KP, n=10 for KPO. Statistical test: Unpaired t-test, Error bar: SD.
(F) Total mutations/MB determined by whole exome sequencing of KP vs KPO tumors. N=3 for KP, n=5 for KPO, Mann Whitney test, Error bar: standard error of the mean (SEM).
(G) Distribution of the type of mutations in KP vs KPO tumors.
(H) TMB (Tumor Mutational Burden) in NSCLC (Non-Small Cell Lung Carcinoma) patients classified based on TP53 status from MSKCC35 and DFCI cohort. Sample n: sample number.
(I) Lung tumor volume quantification of KP and KPO mice treated with ICB after tumor confirmation by MRI. Changes in tumor volumes at indicated timepoints after treatment initiation is shown. N=10 for KP-isotype, n=14 for KP-ICB, n=14 for KPO-isotype, n=15 for KPO-ICB, Error bar: SD.
(J) Representative MRI images from the mice in H, 2 weeks after treatment initiation. Arrows point to tumors. H: heart.
(K) Survival of treated mice in H.
Also see Figure S1.

