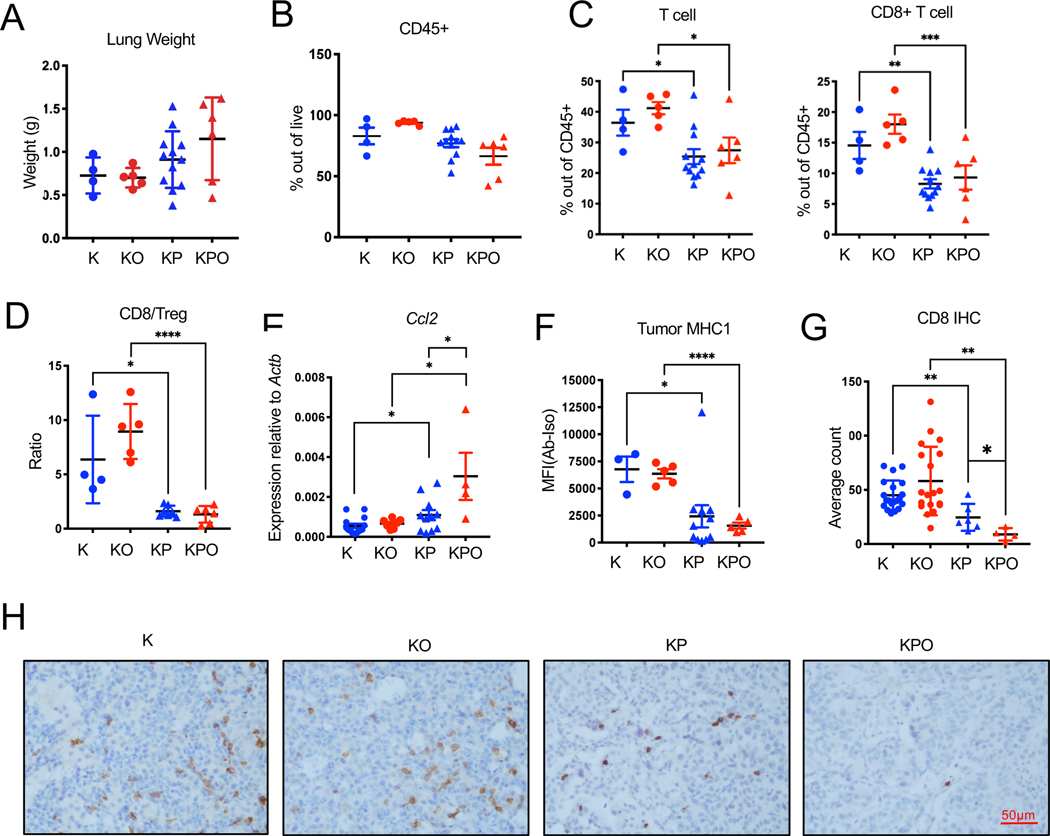
Figure 4. Immune profile of Pole+/+ or PoleP286R/+ GEMMs.
Tumor microenvironment of K/KO, KP/KPO mouse lungs were analyzed by flow cytometry and immunohistochemistry.
(A) Lung weights of analyzed of the mice included in analysis. Mice were euthanatized at 16 weeks after tumor induction. N=4 for K, n=5 for KO, n=12 for KP, n=6 for KPO. Error bar: SD.
(B) Total CD45+ cell percentage out of all live cells in K, KO, KP, and KPO tumors determined by flow cytometry. N=4 for K, n=5 for KO, n=12 for KP, n=6 for KPO. Error bar: SEM.
(C) Total T cell (CD3+) and cytotoxic T cell (CD3+CD8+) percentages out of all CD45+ cells in K, KO, KP, KPO tumors. N=4 for K, n=5 for KO, n=12 for KP, n=6 for KPO. Error bar: SEM. Unpaired t-test.
(D) Quantification of CD8/Treg ratios in K, KO, KP, and KPO tumors. N=4 for K, n=5 for KO, n=7 for KP, n=6 for KPO. Error bar: SD. Unpaired t-test.
(E) CCL2 levels in lung tumors were determined by qPCR of RNA extracted from lung tumor tissues. N=14 for K, n=7 for KO, n=11 for KP, n=4 for KPO. Error bar: SEM. Unpaired t-test.
(F) Expression of MHC1 on GEMM tumor cells (Epcam+) determined by flow cytometry of K, KO, KP, and KPO lung tissue. N=3 for K, n=5 for KO, n=11 for KP, n=5 for KPO. Error bar: SEM. Unpaired t-test.
(G) Quantification of CD8 T cells from the IHC staining of K, KO, KP and KPO GEMM lung tissues. N=20 for K, n=19 for KO, n=6 for KP, n=4 for KPO. Error bar: SD. Statistical test: Unpaired t-test.
(H) Representative IHC images of CD8 IHC in K, KO, KP and KPO GEMMs.
Also see Figure S2.

