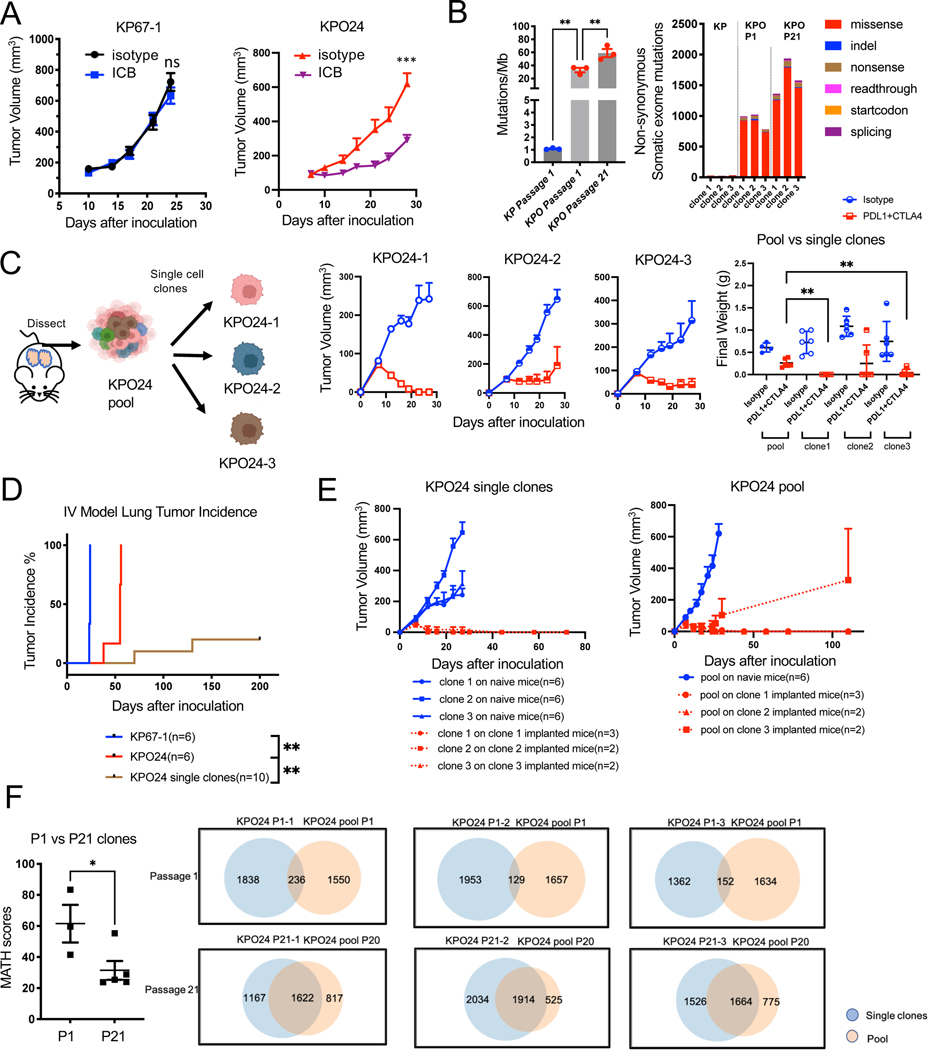
Figure 5. Tumor heterogeneity contributes to immune escape in KPO syngeneic model.
(A) Growth curve for subcutaneously implanted KP67–1 (n=8 for isotype, n=8 for ICB, Error bar: SEM. Unpaired t-test.) derived from KP tumors and KPO24 (n=4 for isotype, n=6 for ICB, Error bar: SEM. Unpaired t-test.) derived from KrasG12D/+;p53−/;PoleP286R/+ syngeneic models treated with isotype control or ICB. ns: not significant.
(B) Left: Tumor mutational burden (TMB) of KP cell line (passage 1) and KPO cell line clones KPO24–1, KPO24–2, and KPO24–3 at passage 1 and passage 21. Right: Distribution of mutation types in KP vs KPO syngeneic cell lines. N=3 per group. Error bar: SEM. Unpaired t-test.
(C) Schema for generating single cell clones from KPO24. In vivo tumor growth of single clones 1–3 (n=6 for isotype, n=6 for ICB, Error bar: SEM in curve, SD in scatterplot. Unpaired t-test.) derived from syngeneic cell line KPO24 implanted subcutaneously and treated with isotype or ICB. Weights of dissected tumors shown on the right.
(D) Lung tumor incidence for KP67–1 and KPO24 pool or single cell clones derived from KPO24 cells injected intravenously (IV) into mice. Any tumor presence was recorded as an incidence. Log-rank test.
(E) Re-challenge experiment with pool vs single clone models. Growth of KPO24 single clone on either tumor/treatment-naïve mice or mice which were previously implanted with corresponding single clone KPO tumors that regressed upon ICB (left). Growth of KPO24 pool syngeneic line on either tumor/treatment naïve mice or mice which previously were implanted with single clone KPO tumors that regressed with ICB (left). Error bar: SEM.
(F) Quantification of MATH (Mutant-Allele Tumor Heterogeneity) score of KPO syngeneic lines between passage 1 and passage 21 (left). Venn diagram showing the number of shared mutations between KPO single clone and corresponding pool in passage 1 vs 21 (right). N=3 for p1, n=5 for >p20. Error bar: SEM. Unpaired t-test.)
Also see Figures S3, S4, and S5.

