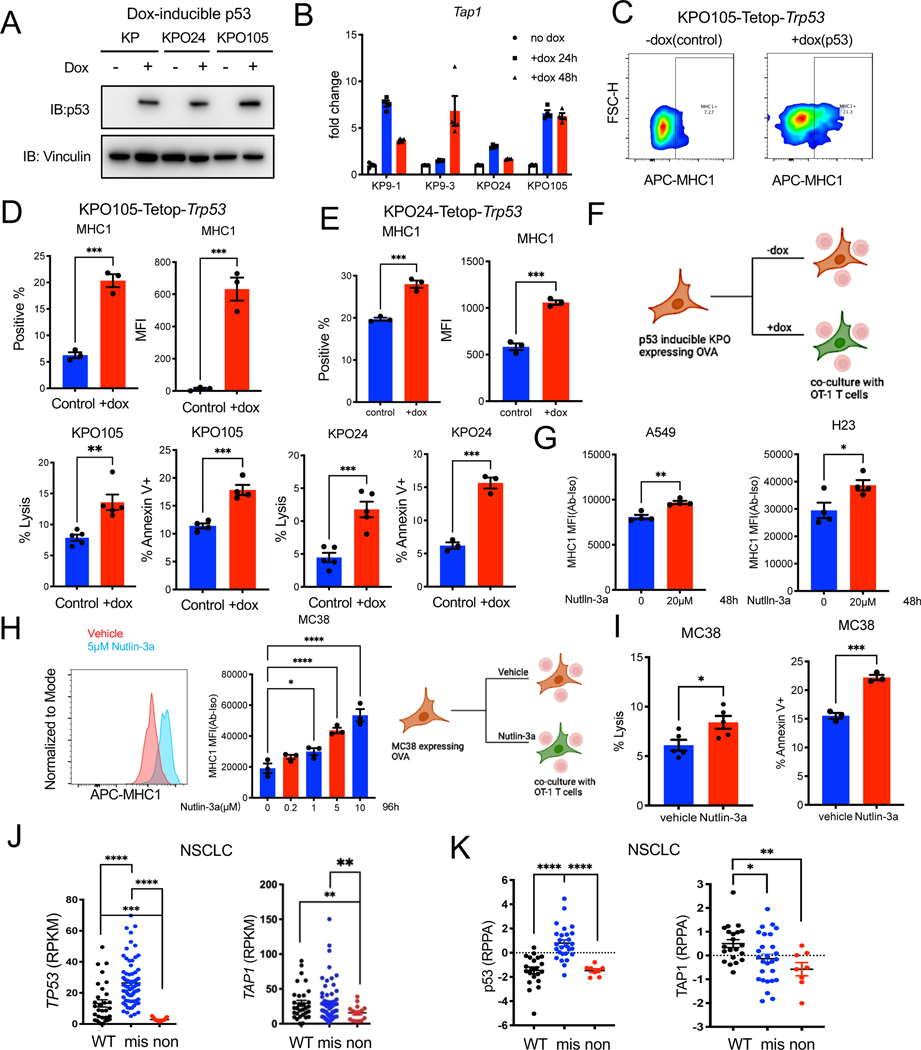
Figure 6. p53 induction increases immunogenicity of tumor cells and induces T cell cytotoxicity.
(A) Western blot for p53 and vinculin in KP, KPO lines stably transduced with pLVX-Tet-ON Advanced and pLVX-Tight puro-Trp53 and treated with doxycycline for 48 hours.
(B) qPCR for Tap1 in KP and KPO-TetOp-Trp53 lines treated with doxycycline for the indicated times. N=3 per group. Error bar: SD.
(C) Representative contour plot showing MHC1 expression in KPO105-TetOp-Trp53 model treated with doxycycline for 48 hours as determined by flow cytometry.
(D) Quantification of MHC1 expression determined by flow cytometry in KPO105-TetOp-Trp53 model with and without doxycycline. N=3 for control, n=3 for +dox. Error bar: SEM. Unpaired t-test.
(E) Quantification of MHC1 expression in KPO24-TetOp-Trp53 model treated with doxycycline for 48 hours as determined by flow cytometry. N=3 for control, n=3 for +dox. Error bar: SEM. Unpaired t-test.
(F) T cell specific killing measured by LDH release of co-cultures of p53 inducible KPO lines (KPO105 and KPO24) expressing OVA with OT-1 T cells isolated from OT-1 transgenic mouse spleens. Apoptosis of tumor cells was evaluated by Annexin V staining and analyzed by flow cytometry. LDH lysis: n=5 for control, n=5 for +dox. Error bar: SEM. Unpaired t-test. Annexin V staining: n=3 for control, n=3 for +dox. Error bar: SEM. Unpaired t-test.
(G) MHC1 expression in human NSCLC lines A549 and H23 treated with 20μM Nutlin-3a for 48h determined by flow cytometry. N=4 for vehicle, n=4 for Nutlin-3a. Error bar: SEM. Unpaired t-test.
(H) MHC1 expression in MC38 cells treated with varying Nutlin-3a doses for 96h as determined by flow cytometry. N=3 per group. Error bar: SEM. Unpaired t-test.
(I) T cell specific killing measured by LDH release in co-cultures of nutlin-3a pre-treated OVA expressing MC38 cells with OT-1 T cells. Apoptosis of tumor cells was measured by Annexin V staining and analyzed by flow cytometry. LDH lysis: n=5 for control, n=5 for +dox. Error bar: SEM. Unpaired t-test. Annexin V staining: n=3 for control, n=3 for +dox. Error bar: SEM. Unpaired t-test.
(J) TP53 and TAP1 mRNA level in NSCLC lines with wild-type, missense or nonsense TP53 mutations from Cancer Cell Line Encyclopedia (CCLE).
(K) p53 and TAP1 protein levels in NSCLC lines with WT, missense or nonsense TP53 mutations (data from CCLE).
Also see Figure S6.

