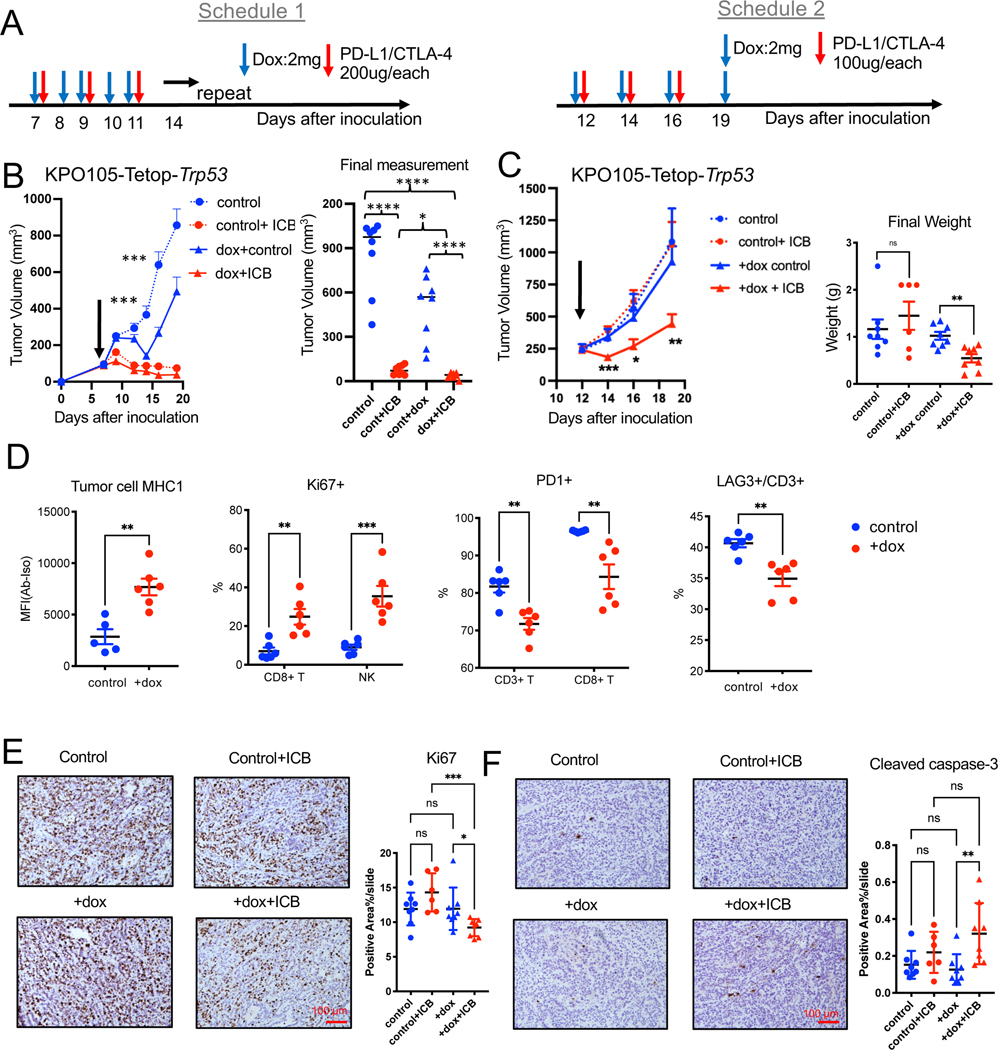
Figure 7. p53 induction increases sensitivity to ICB in vivo.
(A) Schedules for combination treatments of doxycycline and ICB.
(B) Growth of subcutaneous KPO105-TetOp-Trp53 tumors treated with doxycycline, ICB, or combination of doxycycline and ICB with schedule 1 at baseline volume of 100mm3. Final measurements of tumor volumes are shown on the right. n=8 for control. n=8 for Control+ICB. n=8 for +dox control. n=8 for +dox+ICB. Error bar: SEM. Unpaired t-test. ***: comparison of control and +dox groups.
(C) Growth of subcutaneous KPO105-TetOp-Trp53 tumors treated with doxycycline (dox), ICB, or combination of doxycycline and ICB with schedule 2 at baseline volume of 250mm3 (left) and weights of final dissected tumors are shown on the right. n=8 for control. n=6 for Control+ICB. n=8 for +dox control. n=8 for +dox+ICB. Error bar: SEM. Unpaired t-test.
(D) Flow cytometry analysis of KPO105-TetOp-Trp53 tumors from mice treated with vehicle or doxycycline showing expression on MHC1 on tumor cells (Epcam+) (n=5 for control, n=6 for +dox), and other markers (Ki67, PD-1, LAG-3+) (n=6 for control, n=6 for +dox) on CD3+ T cells, CD8+ T cells or NK cells. Error bar: SD. Unpaired t-test.
(E) IHC for Ki67 on KPO105-TetOp-Trp53 tumors treated with doxycycline, ICB, or combination of doxycycline and ICB (schedule 1). Representative images are shown on the left and quantification of stained area are shown on the right. n=8 for control. n=6 for Control+ICB. n=8 for +dox control. n=8 for +dox+ICB. Error bar: SD. Unpaired t-test.
(F) IHC for cleaved caspase-3 on KPO105-TetOp-Trp53 tumors treated with doxycycline, ICB, or combination of doxycycline and ICB (schedule 1). Representative images are shown on the left and quantification of stained area on the right. n=8 for control. n=6 for Control+ICB. n=8 for +dox control. n=8 for +dox+ICB. Error bar: SD. Unpaired t-test.
Also see Figure S6.

