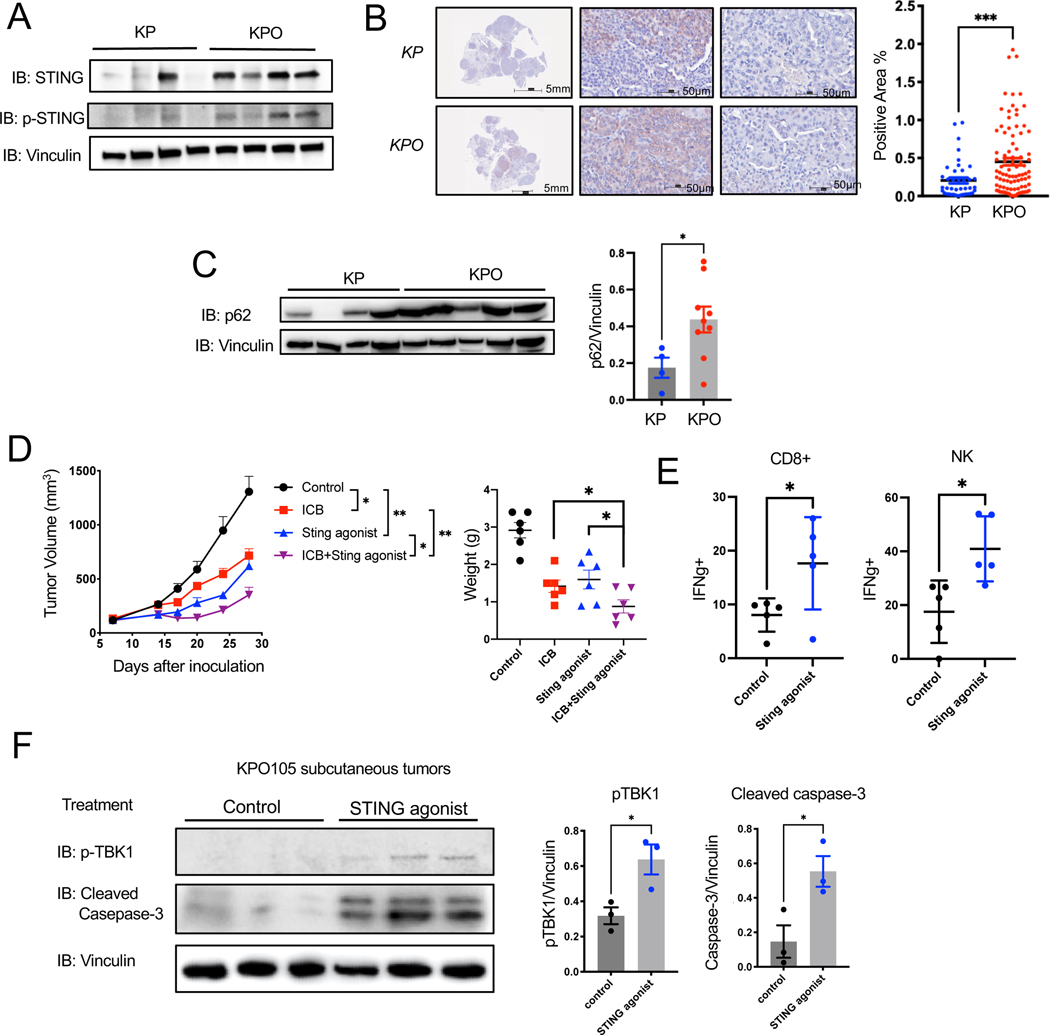
Figure 8. Sting is expressed heterogeneously in PoleP286R lung tumors and is a therapeutic target.
(A) Western blot for STING, pSTING, and vinculin on tumors from KP and KPO GEMMs (top left).
(B) Representative IHC for STING on lung tumors from KP and KPO GEMMs (left). Positive and negative stained tumor nodules are shown from the same mouse tissue scan and quantification of STING IHC in tumor nodules (right). N=41 for KP, N=91 for KPO. Error bar: SEM. Unpaired t-test.
(C) Western blot for p62 and vinculin on tumors from KP and KPO GEMMs. Relative protein amount was quantified by image densitometry. N= 4 for KP, n=9 for KPO. Error bar: SEM. Unpaired t-test.
(D) In vivo tumor growth of KrasG12D/+;Trp53−/;PoleP286R/+ syngeneic cell line KPO105 subcutaneous tumors treated with isotype, Sting agonist (PolySTING), ICB or combination of ICB and Sting agonist. The final weight of dissected tumors at experiment termination was graphed. n=6 for control, n=6 for ICB, n=6 for Sting agonist, n=6 for Sting agonist+ICB. Error bar: SEM. Unpaired t-test.
(E) Flow cytometry analysis of KPO syngeneic tumors treated with control or Sting agonist. Quantification of Intracellular staining for IFNγ+ on CD8+ T cells or NK cells. n=5 for control, n=5 for Sting agonist. Error bar: SD. Unpaired t-test.
(F) Western blot for pTBK1 and cleaved caspase-3 on KPO105 subcutaneous tumors treated with vehicle or STING agonist. Relative protein amount was quantified by image densitometry. n=3 for control, n=3 for Sting agonist. Error bar: SD. Unpaired t-test.
Also see Figures S7 and S8.

