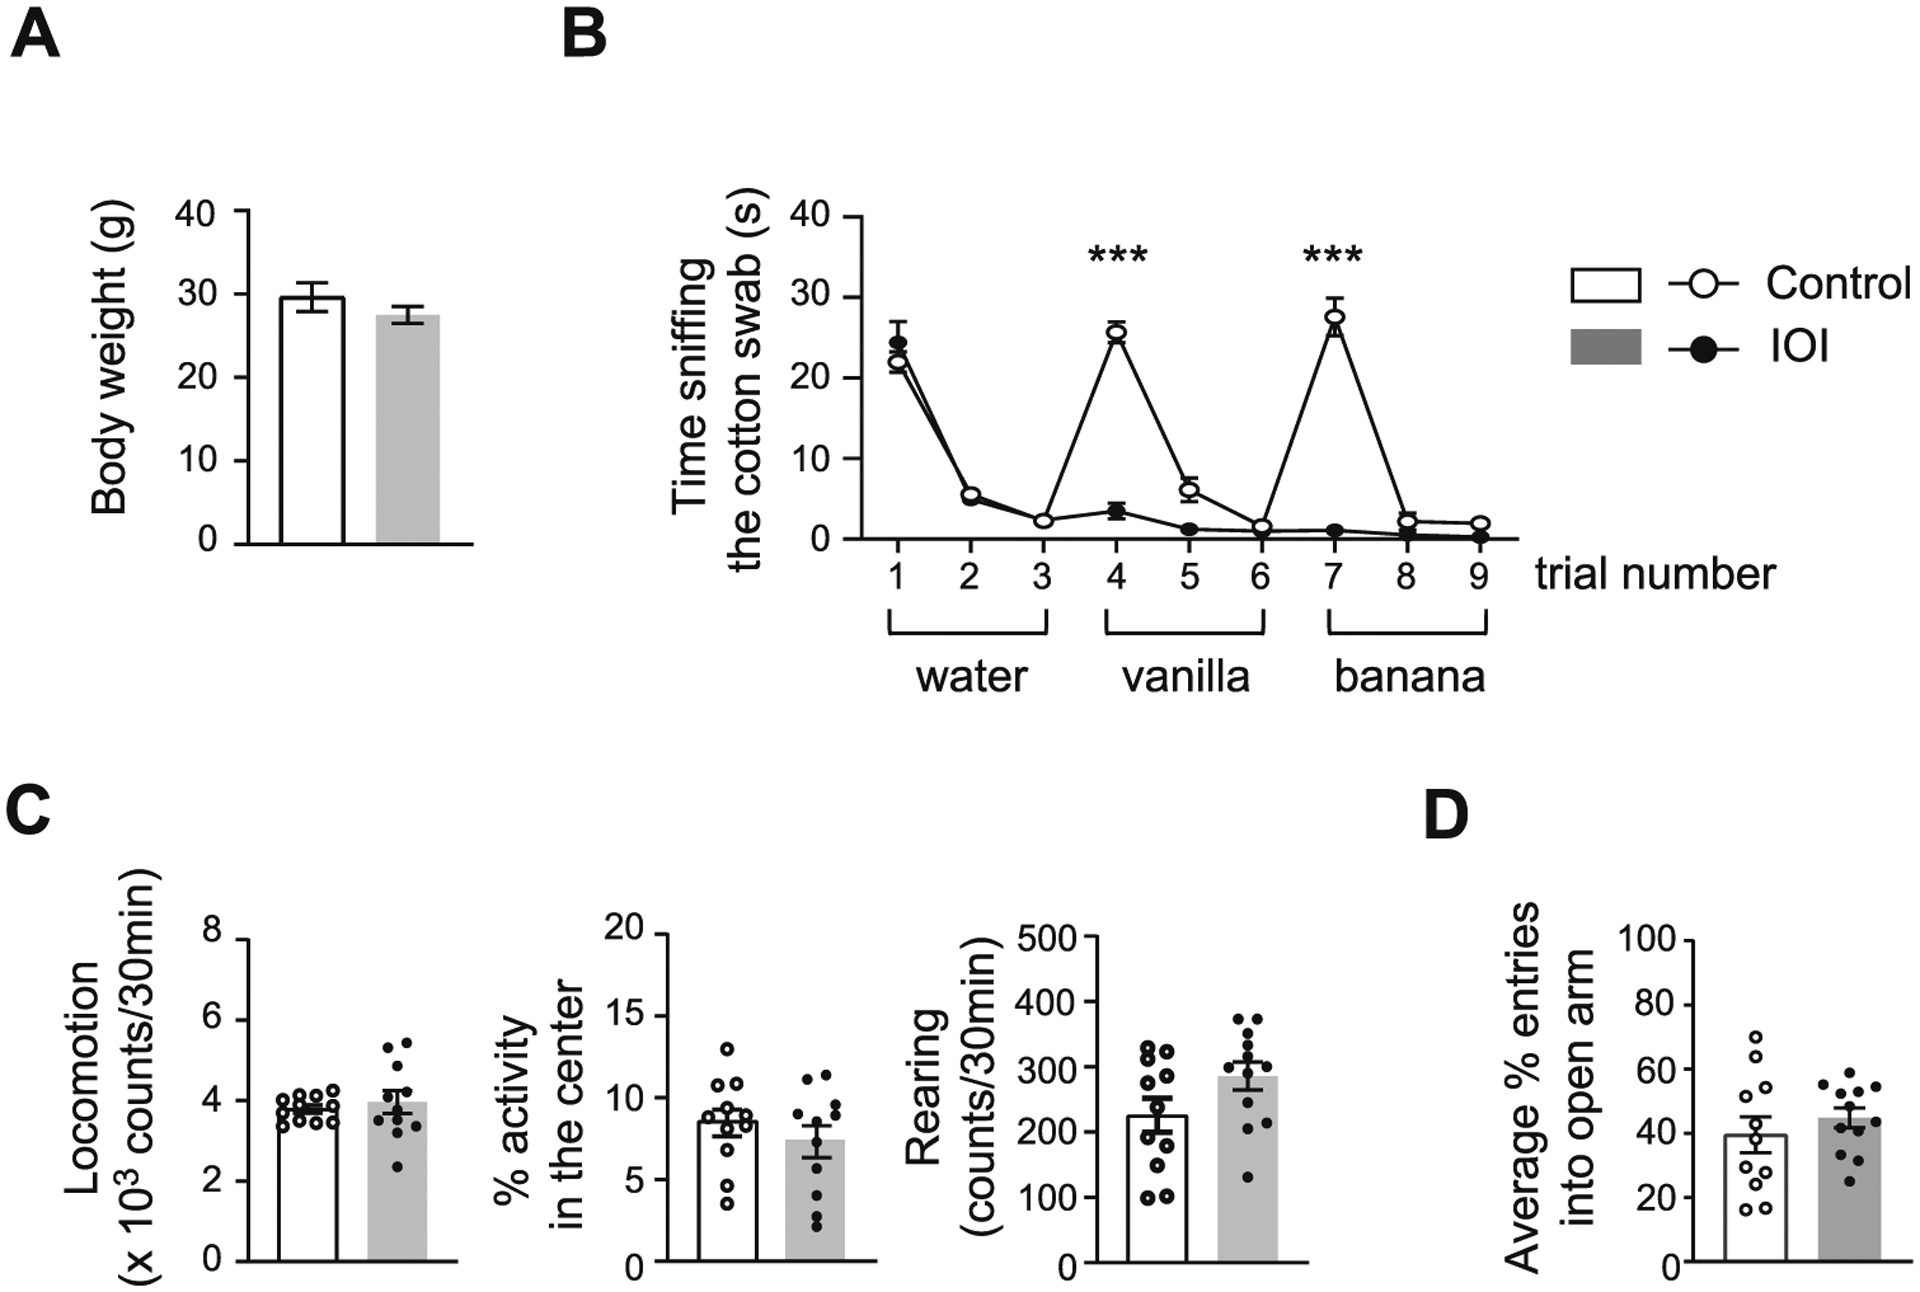
Fig. 1.

Chronic OE inflammation impairs olfactory discrimination and has no effect on locomotion and anxiety. (A) There was no difference in body weight between IOI mice and control mice. p = 0.2904, t = 1.102, df = 13 determined by Student’s t-test. IOI, n = 8 (7 male, 1 female); Control, n = 7 (6 male, 1 female). Data are presented as the mean ± SEM. (B) The mice were subsequently exposed to water and two different odorants (i.e., vanilla and banana) 3 consecutive times. The control mice showed an increase in time sniffing to water and both odorants for the first time, whereas IOI mice displayed no response to either odorant, suggesting that chronic OE inflammation impairs olfactory discrimination. Dishabituation: odor of water to vanilla; F1,13 = 220.1, ***p < 0.0001 for genotype × odor by two-way ANOVA; Bonferroni’s post hoc tests with multiple comparisons were used to examine the differences between water and vanilla, Control: p < 0.0001; IOI: p = 0.5757. Dishabituation: odor of vanilla to banana; F1,20 = 117.7, ***p < 0.0001 for genotype × odor by two-way ANOVA; Bonferroni’s post hoc tests with multiple comparisons were used to examine the differences between vanilla and banana, Control: p < 0.0001; IOI: p > 0.9999. IOI, n = 8 (7 male, 1 female); Control, n = 7 (6 male, 1 female). Data are presented as the mean ± SEM. (C) IOI mice showed no changes in locomotion (left); p = 0.5720, t = 0.5746, df = 21 determined by Student’s t-test, percentage of time spent in central area (middle); p = 0.3797, t = 0.8984, df = 21 determined by Student’s t-test, and rearing (right); p = 0.0870, t = 1.795, df = 21 determined by Student’s t-test as indicated by the open field test. IOI, n = 12 (7 male, 5 female); Control, n = 11 (6 male, 5 female). Data are presented as the mean ± SEM. (D) No difference was found in the percentage of entries into the open arm between groups as indicated by the elevated plus maze test. p = 0.4068, t = 0.8465, df = 21 determined by Student’s t-test. IOI, n = 12 (7 male, 5 female); Control, n = 11 (6 male, 5 female). Data are presented as the mean ± SEM
