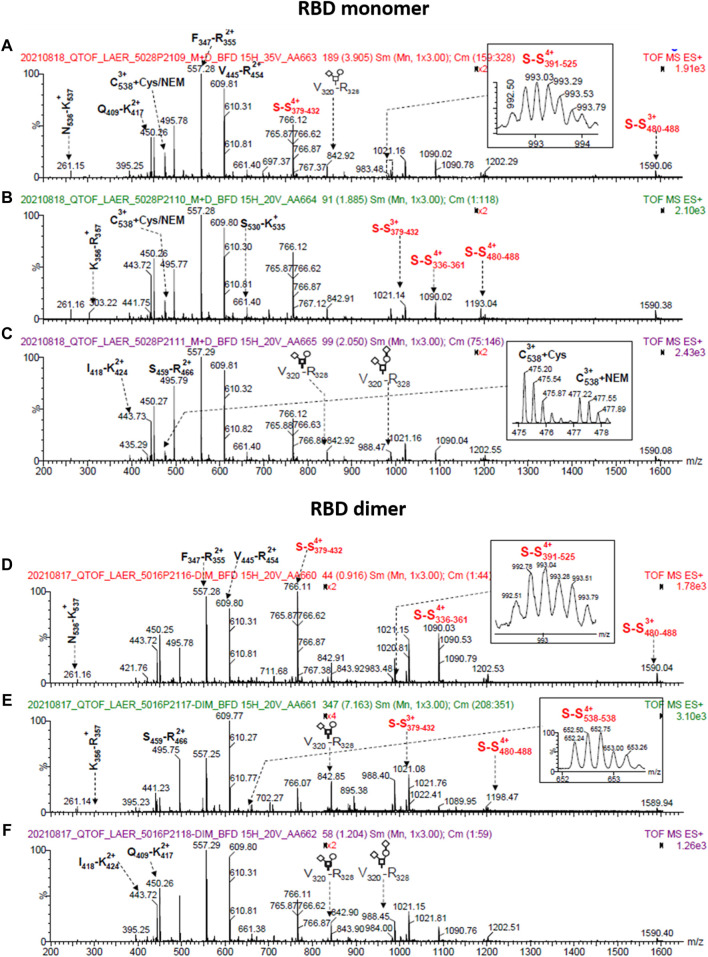
FIGURE 8.
ESI-MS spectra of RBD (319-541)-His6 species produced on a large scale (500 L). The spectra correspond to samples that were deglycosylated with PNGase F in the presence of 5 mM N-ethylmaleimide and digested in solution with trypsin. The top panel displays spectra of RBD monomer from batches 5028/P2109 (A), 5028/P2110 (B), and 5028/P2111 (C). The bottom panel shows spectra of RBD dimer from batches 5016/P2116 (D), 5016/P2117 (E), and 5016/P2118 (F). The spectra insets provide magnified m/z regions, and the O-glycan structures conform to the SNFG (symbol nomenclature for glycans) system. The S-S notation refers to peptides with disulfide bonds.

