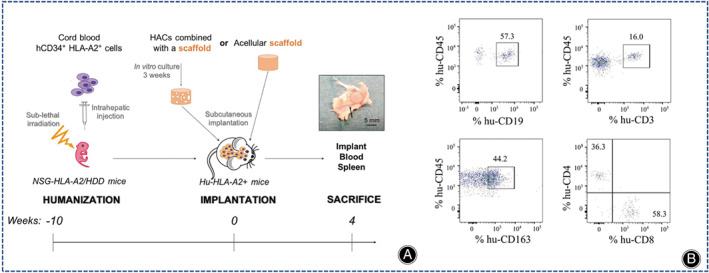
Fig. 9.

(A) Experimental flow diagram. Black shaded circles represent cartilage structures on the skin and black arrows point to capillaries. (B) Results of flow cytometric analysis of hCD34+ hematopoietic stem cells 10 weeks after inoculation. (Figures are adapted with permission from Perrier‐Groult et al. 107 ).
