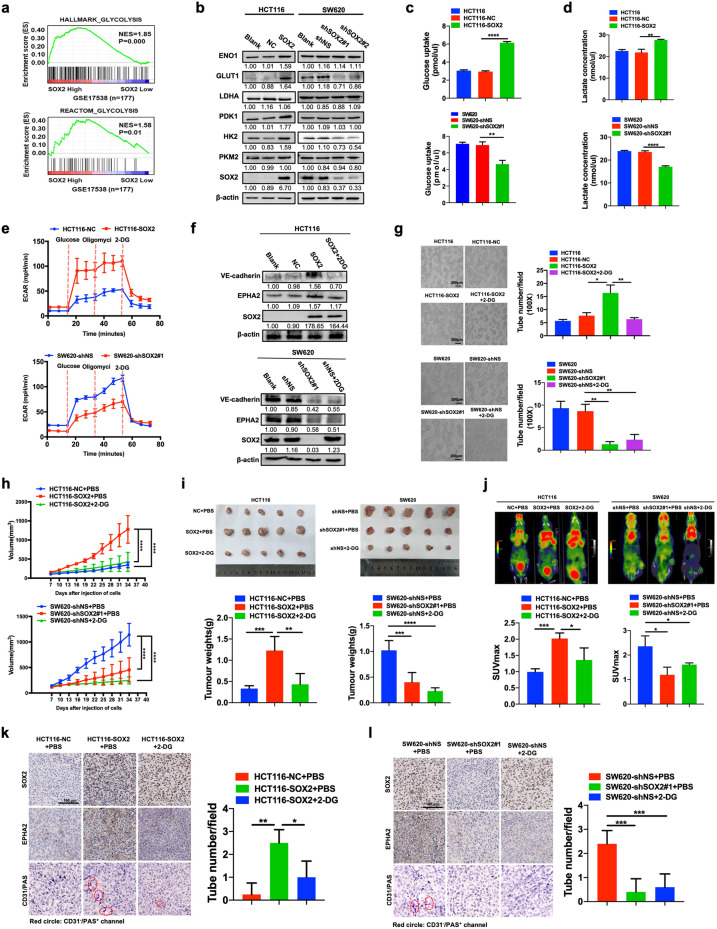
Fig. 1. SOX2 promotes vasculogenic mimicry in CRC cells by stimulating glycolysis in vitro and in vivo.
a GSEA showing that increased expression of SOX2 was positively correlated with glycolysis in gene expression profiles for patients with CRC (TCGA, n = 177). b Western blotting examining the expression of SOX2 and glycolytic molecules in HCT116 and SW620 cells after a 72 h transfection with a SOX2 clone or SOX2 shRNA. c, d The effect of SOX2 on glucose consumption (c) and lactate production (d) was assessed using fluorescence-based kits in HCT116 and SW620 cells (mean ± SD; n = 3, two-tailed Student’s t test). e The effect of SOX2 on ECAR was measured using a Seahorse XF assay in HCT116 and SW620 cells (mean ± SD; n = 3). f, g HCT116 and SW620 cells were transfected for 72 h using a SOX2 clone or SOX2 shRNA, then treated with 2-DG (3 mM) for 24 h. Western blotting was performed to analyze the indicated proteins (f). A tube formation assay was performed to assess VM formation (g, Scale, 200 μm; mean ± SD; n = 3, two-tailed Student’s t test). h Plots of tumor volumes, measured every three days (mean ± SD; n = 5, two-way ANOVA test). i Representative tumor images and a summary of tumor weight data. Tumors were harvested after mice were euthanized (mean ± SD; n = 5, two-tailed Student’s t test). j 18F-FDG uptake and SUVmax of xenografts were examined using PET/CT (mean ± SD; n = 3, two-tailed Student’s t test). k, l IHC staining of SOX2, EPHA2, and CD31/PAS in SOX2-overexpression HCT116 (k) and SOX2-knockdown SW620 xenografts (l, Scale, 100 μm). The number of VM structures (CD31−/PAS+) was calculated (mean ± SD; n = 4, two-tailed Student’s t test). *p < 0.05, **p < 0.01, ***p < 0.001, and ****p < 0.0001.

