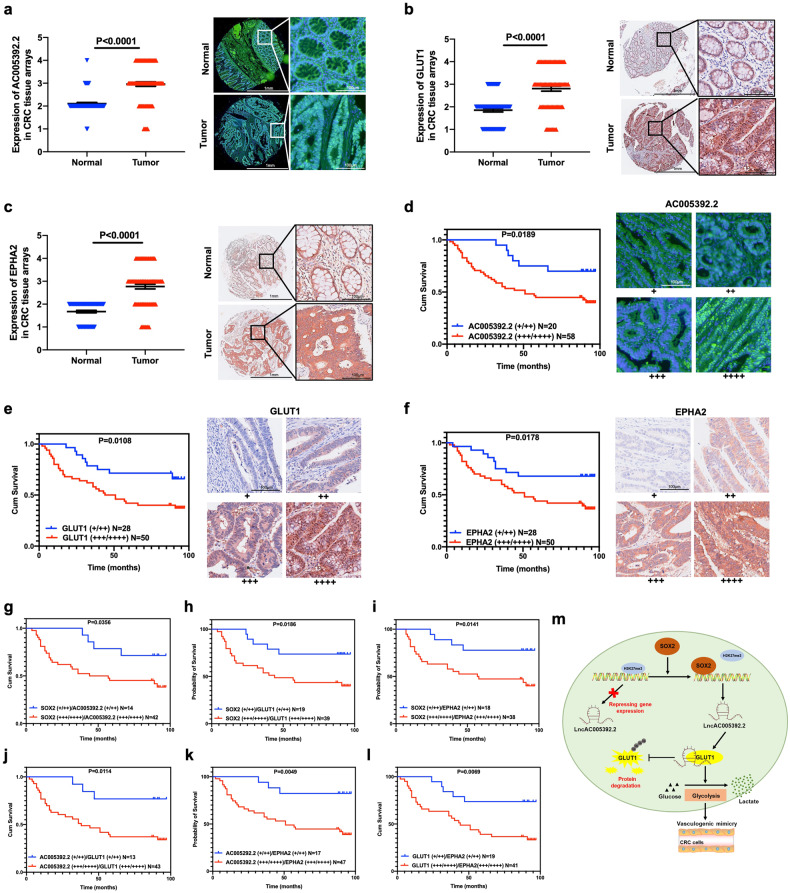
Fig. 6. Expression of AC005392.2, GLUT1, and EPHA2 in clinical samples.
a–c The intensity of staining of malignant cells was scored to analyze levels of AC005392.2 (a), GLUT1 (b), and EPHA2 (c) were examined by FISH and IHC in a microarray with 78 pairs of CRC tissues (Scale, 1 mm; inset: scale, 100 μm; mean ± SD; Normal = 74, Tumor = 78, two-tailed Student’s t test). Representative sections are shown. d–f Survival curves were generated using the Kaplan–Meier method (median values as cutoff) according to the expression of AC005392.2 (d), GLUT1 (e), and EPHA2 (f). Representative sections are shown (Scale, 100 μm, n = 78, log-rank test). g–i Survival curves of CRC patients stratified by high or low expression of SOX2 and AC005392.2 (g, n = 56), GLUT1 (h, n = 58) or EPHA2 (i, n = 56) were estimated using the Kaplan–Meier method and compared using the Log-rank test (median values as cutoff, log-rank test). j, k Survival curves of CRC patients stratified based on high or low expression of AC005392.2 and GLUT1 (j, n = 56) or EPHA2 (k, n = 64) were estimated using the Kaplan-Meier method and compared using the Log-rank test (median values as cutoff, log-rank test). l Survival curves of CRC patients stratified by high or low expression of GLUT1 and EPHA2 were estimated using the Kaplan–Meier method and compared using the Log-rank test (median values as cutoff, n = 60, log-rank test). m A schematic model of the molecular mechanism by which SOX2 Promotes VM formation in CRC.

