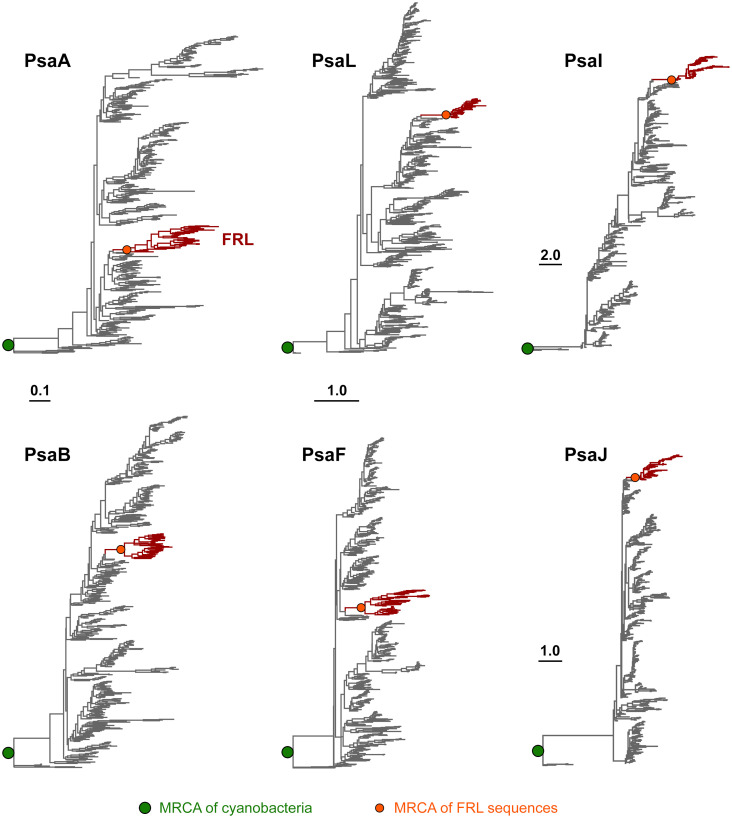
Figure 2.
Maximum Likelihood phylogenetic trees of PSI subunits. Each tree was rooted placing sequences from the Gloeobacterales as an outgroup. Branches in gray represent VL subunits, while those in red show the FRL subunits. Scale bars denote amino acid substitutions per site, for PsaA and PsaB, PsaL and PsaF, PsaI, and PsaJ, respectively.

