Figure 3.
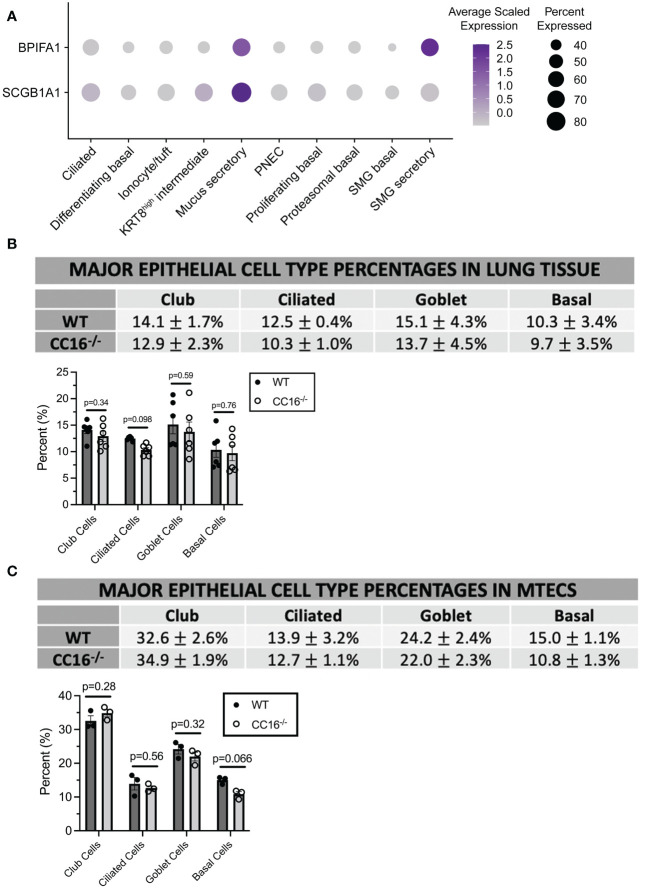
CC16 deficiency does not affect epithelial cell differentiation. (A) Dot plot showing the average normalized expression of BPIFA1 and SCGB1A1 (rows) across cell types (columns) generated from single-cell RNA sequencing data of healthy adult tracheal epithelial cells described in Goldfarburen et al. (33). The color of the dot represents the average gene expression in the cell type and the diameter of the dot indicates the fraction of cells that express the gene within the cell type. (B, C) Major epithelial cell type expression was measured in WT (n=6) and CC16-/- (n=6) mice (B) and in WT (n=3) and CC16-/- (n=3) MTECS (C) using flow cytometry. Indirect FACs staining was used to identify club (CYP2F2), ciliated (TUBA1A), goblet (MUC5AC), and basal (KRT5) expression. No significant differences in epithelial cell expression were observed between WT and CC16-/- mice and MTECs by Unpaired t test. NS=not significant. Data are presented as mean±SEM.

