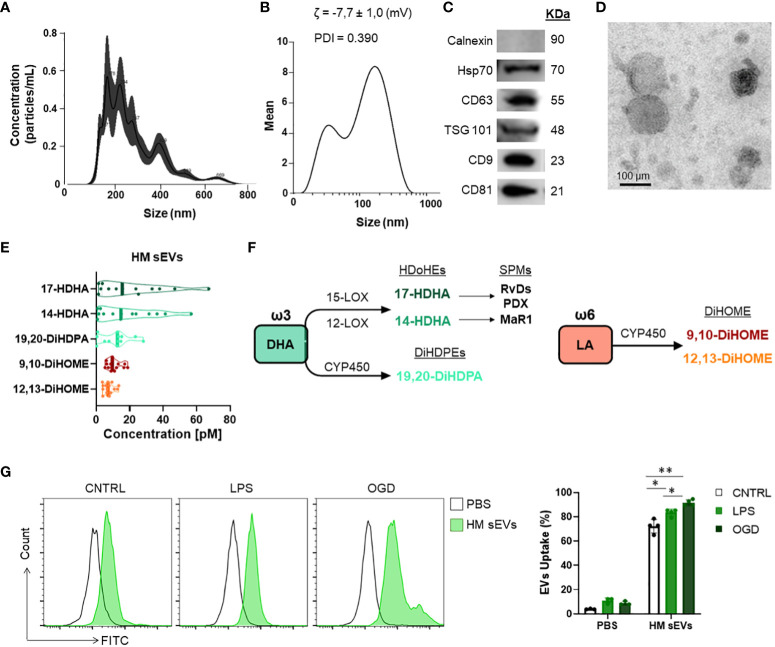
Figure 1.
Characterization of HM sEVs and oxylipin content. (A) Representative images of HM sEVs assessed by nanoparticle tracking and (B) DLS analysis; (C) representative western blots of Hsp70, CD63, TSG101, CD81 and CD9 proteins in 30 μg of HM sEVs; absence of calnexin signifies a pure sEVs preparation (D) representative transmission electron microscopy images of HM sEVs. Scale bar: 200 nm; (E) concentration [nM] of the more abundant oxylipins in HM sEVs isolated from 25 mL of HM; (F) scheme of oxylipin synthesis; (G) Intestinal epithelial cells were incubated with CFSE-labeled HM sEVs for 3 h at 37°C and sEV internalization was assessed by flow cytometry. As a negative control, PBS was mixed with CFSE and added to cells in parallel. Representative histograms are shown. sEV internalization was measured by fluorescence intensity and is represented as the percentage of sEV uptake. Graphs represent mean ± SD of four independent experiments. Two-way ANOVA was used for statistical analysis. *p< 0.05, **p< 0.01.

