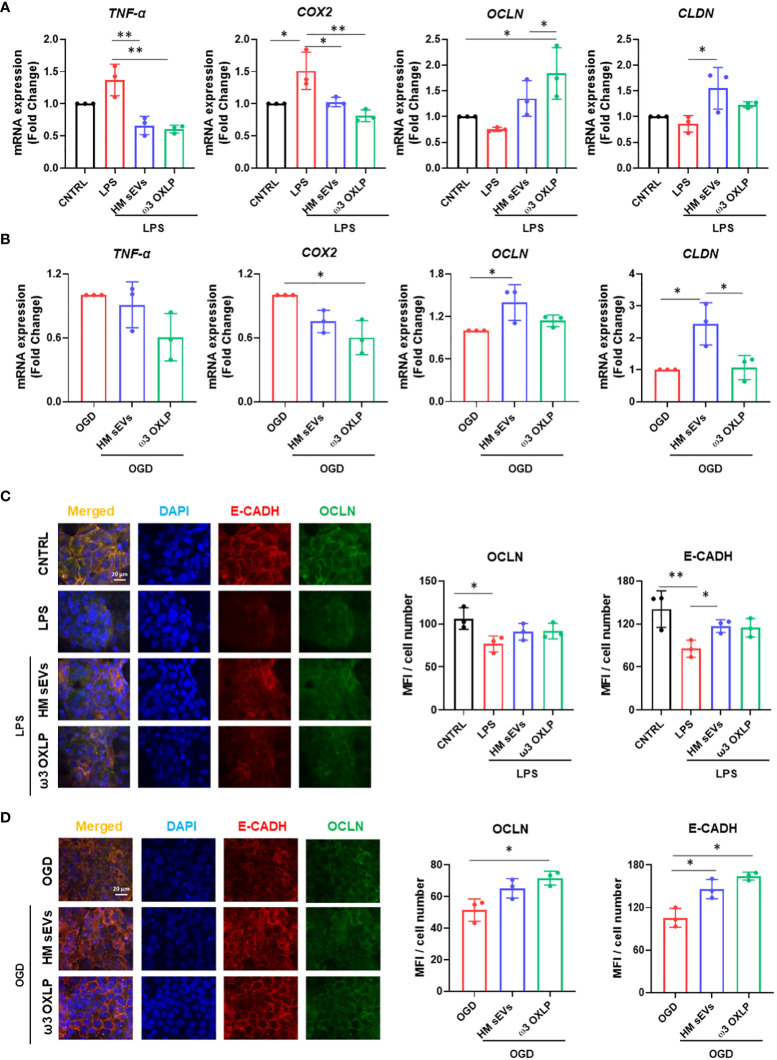
Figure 3.
HM sEVs and ω3 OXLP dampen inflammatory responses in the inflamed epithelium. (A) Expression levels of TNF-α, COX-2, OCLN and CLND quantified by RT-qPCR in intestinal cells stimulated with lipopolysaccharides (LPS) and/or treated with 7.5 µg/mL sEVs or 0.5 nM of each of the three ω3 OXLP. (B) E-cadherin (E-CADH, red) and occludin (OCLN, green) immunofluorescence and nuclei staining (blue) show the distribution of tight junctions in the cell membrane. Unstimulated intestinal cells were used as controls. (C) Expression levels of TNF-α, COX-2, OCLN and CLND quantified by RT-qPCR in intestinal cell cultures under oxygen/glucose deprivation (OGD) condition and/or treated with 7.5 µg/mL sEVs or 0.5 nM of each of the three ω3 OXLP. The expression level of the target gene in each sample was normalized to GAPDH expression. (D) E-cadherin (E-CADH, red) and occludin (OCLN, green) immunofluorescence and nuclei staining (blue) show the distribution of tight junctions in the cell membrane. Scale bar: 20 µm. The bar graph shows the quantification of the mean fluorescence intensity (MFI). The graph represents the mean ± SD of three independent experiments. One-way ANOVA was used for statistical analysis. *p< 0.05, **p< 0.01.

