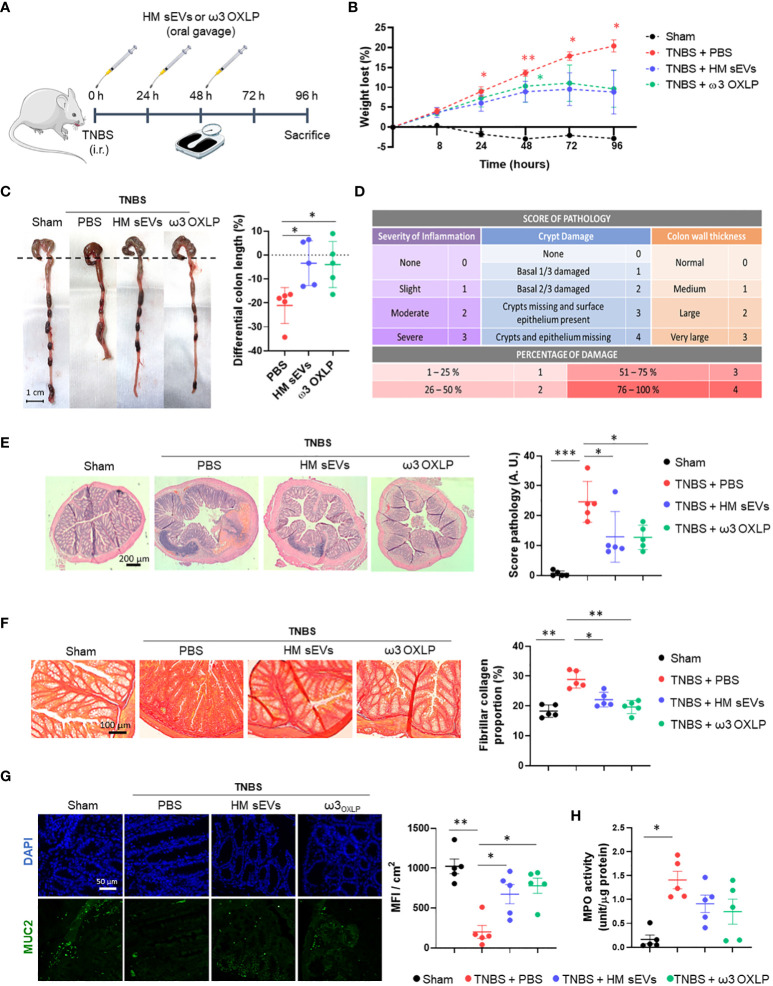
Figure 6.
HM sEVs and ω3 OXLP attenuate disease in mice with TNBS-induced colitis. (A) Scheme of the in vivo experimental design. (B) Measurement of the weight loss of mice throughout the experiment (4 days). (C) Macroscopic images of colon tissue on day 4 after 2,4,6-trinitrobenzenesulfonic acid (TNBS) administration. Scale bar: 1 cm. Percentage differential length of the colon compared with the healthy group (horizontal dotted line). (D) Histology score table based on grade of pathology and percentage of damage. (E) Hematoxylin and eosin staining of representative histological sections of the colon of mice in the healthy group and in the PBS, sEVs and ω3 OXLP groups after TNBS administration. Scale bar: 200 μm. (F) Sirius Red staining was used to detect collagen fibers. Scale bar: 200 μm. Fibrillar collagen proportion (%) was calculated by dividing the area stained with red by the total tissue area. (G) Immunofluorescence of MUC2 (green) and nuclei staining (blue). Scale bar: 50 µm. Bar graph shows quantification of green mean fluorescence intensity (MFI) per cm2. (H) Myeloperoxidase (MPO) activity was measured in colon homogenates. Values were relativized by μg of protein tissue. The graph represents the mean ± SEM of five mice in each group. One-way ANOVA was used for statistical analysis. *p< 0.05, **p< 0.01, ***p< 0.001.

