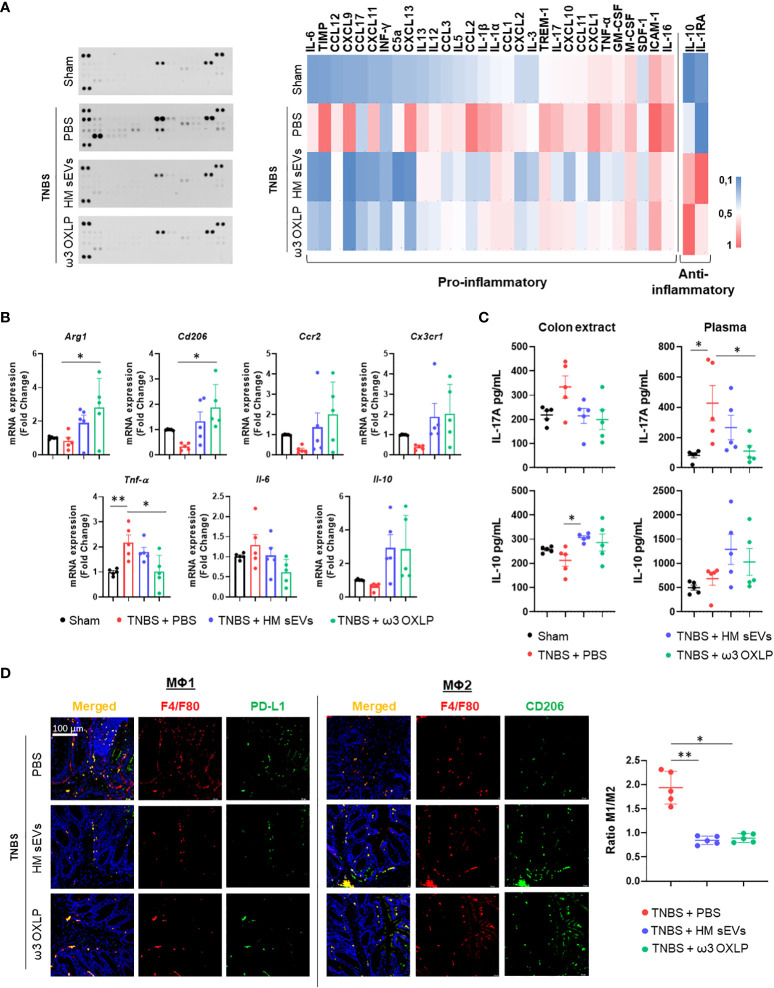
Figure 7.
HM sEVs and ω3 OXLP change the ratio of infiltrating Mφ1/Mφ2. (A) Levels of inflammation-related cytokines were analyzed in colonic tissues by immunoblot array (left). Different time exposition was used to reveal different amounts of protein. The relative expression of each cytokine was quantified and represented in a heat map (right); data are representative of a pool of five animals per group. (B) ArgI, Cd206, Ccr2, Cx3cr1, TNFα, Il-6, and Il-10 mRNA expression levels quantified by RT-qPCR in colon. Sham group was used as a control. Expression level of the target gene in each sample was normalized to β-actin expression. Graphs represent mean ± SEM of fold change of five independent experiments. (C) ELISA assay to assess IL-17A and IL-10 production (pg/mL) in colon extracts and plasma. (D) Immunodetection of F4/F80 (pan-macrophage marker, red) and PD-L1 (Mφ1, green) or CD206 (Mφ2, green) in colon samples 4 days after TNBS-induced colitis. Scale bar: 100 μm. Quantification of double-positive cells per mm2. Ten sections of 0.14 mm2 per mouse were analyzed. Graphs represent the Mφ1/Mφ2 ratio ± SEM of five mice. One-way ANOVA was used for statistical analysis. *p< 0.05, **p< 0.01.

