

Abstract
Introduction
Accumulating evidence indicates that the amygdala exhibits early signs of Alzheimer's disease (AD) pathology. However, it is still unknown whether the atrophy of distinct subfields of the amygdala also participates in the transition from healthy cognition to mild cognitive impairment (MCI).
Methods
Our sample was derived from the AD Neuroimaging Initiative 3 and consisted of 97 cognitively healthy (HC) individuals, sorted into two groups based on their clinical follow‐up: 75 who remained stable (s‐HC) and 22 who converted to MCI within 48 months (c‐HC). Anatomical magnetic resonance (MR) images were analyzed using a semi‐automatic approach that combines probabilistic methods and a priori information from ex vivo MR images and histology to segment and obtain quantitative structural metrics for different amygdala subfields in each participant. Spearman's correlations were performed between MR measures and baseline and longitudinal neuropsychological measures. We also included anatomical measurements of the whole amygdala, the hippocampus, a key target of AD‐related pathology, and the whole cortical thickness as a test of spatial specificity.
Results
Compared with s‐HC individuals, c‐HC subjects showed a reduced right amygdala volume, whereas no significant difference was observed for hippocampal volumes or changes in cortical thickness. In the amygdala subfields, we observed selected atrophy patterns in the basolateral nuclear complex, anterior amygdala area, and transitional area. Macro‐structural alterations in these subfields correlated with variations of global indices of cognitive performance (measured at baseline and the 48‐month follow‐up), suggesting that amygdala changes shape the cognitive progression to MCI.
Discussion
Our results provide anatomical evidence for the early involvement of the amygdala in the preclinical stages of AD.
Highlights
Amygdala's atrophy marks elderly progression to mild cognitive impairment (MCI).
Amygdala's was observed within the basolateral and amygdaloid complexes.
Macro‐structural alterations were associated with cognitive decline.
No atrophy was found in the hippocampus and cortex.
Keywords: Alzheimer's disease (AD), amygdala, magnetic resonance imaging (MRI), mild cognitive impairment (MCI), preclinical, subfields
1. BACKGROUND
Alzheimer's disease (AD) is a common age‐related neurodegenerative form of dementia. 1 Abnormal deposits of aggregated proteins, specifically hyper‐phosphorylated tau and β‐amyloid (Aβ), play a crucial role in AD development. However, other molecular determinants actively participate in the process. 2 Aβ accumulation initiates in medial cortical regions, including the precuneus, whereas tau pathology begins to propagate from hippocampal areas. 1 Clinically, AD is characterized by progressive and irreversible cognitive/behavioral deficits 1 that result from a prolonged pathological evolution, beginning with an extended preclinical period (15 to 20 years) and evolving through a prodromal phase known as mild cognitive impairment (MCI, 6 to 8 years). Although the early stage of the disease is a critical window to develop and implement effective therapeutic interventions and promote resilience to cognitive decline, 3 identifying subjects at risk of developing AD still represents a tentative effort.
Magnetic resonance imaging (MRI) is a non‐invasive, powerful tool that can quantify, in vivo, brain macro‐structural modifications across the AD spectrum, thus potentially identifying early signs of deterioration. 4 MRI studies have predominantly focused on identifying grey matter (GM) biomarkers of the conversion from MCI to AD. 5 , 6 Since the spread of tau pathology represents a key neuropathological determinant of cognitive decline associated with AD, 1 most of these studies investigated the mesial temporal lobe (MTL), 7 , 8 such as the hippocampal formation. However, little is still known about the earlier macro‐structural signs of the conversion from cognitively healthy (HC) subjects to MCI. Some evidence has shown that the hippocampus and entorhinal cortex become atrophic in Aβ‐positive cognitively normal individuals 9 or HC subjects. 10 However, no hippocampal alterations have been observed in community‐dwelling individuals lamenting subjective cognitive decline. 8
During the preclinical period, another structure of the MTL, the amygdala, manifests early signs of AD pathology. 11 The process runs alongside aberrant tau accumulation in the hippocampus. 12 The amygdala has bidirectional connections with multiple sensory and multisensory areas and projects to the MTL, the basal ganglia, and other subcortical structures. 13 Functionally, the amygdala is associated with emotion and memory processing, 14 especially in consolidating affectively influenced memories. However, additional primate and human research indicates a more general role of the amygdala in cognition, such as in attention, stimulus value representation, and decision‐making. 14 To date, the evaluation of the early morphometric MRI modifications of the amygdala is still incomplete. 10 , 15 , 16 , 17
The atrophy of the whole amygdala, associated with cognitive decline, has been demonstrated in individuals with subjective cognitive decline 16 , 17 or in Aβ‐positive subjects with concurrent cognitive deficits 15 who had no history of long‐term illness and did not meet the criteria for MCI/dementia. A recent MRI study has shown a faster rate of amygdala atrophy in subjects progressing from HC to MCI and from MCI to AD. 10 However, the structural substrates involving the amygdala in these preclinical stages remain unclear. In particular, a potential limitation of previous studies is that the amygdala has been treated as a whole, while this structure encompasses heterogeneous subfields. The reason for considering the underlying anatomical and functional diversity of the amygdala is that its constituent nuclei are segregated not only by their architecture and connectivity patterns but also by their vulnerability to age‐related neurodegenerative disorders. 18 A seminal study 19 indicated a specific accumulation of AD‐related neuropathology in nuclei receiving and giving rise to hippocampal projections (eg, the accessory basal nucleus, the cortical nuclei, and the cortical transition area).
In contrast, the medial and central nuclei were relatively spared. In this context, the atrophy of distinct amygdala subfields may participate in the clinical progression of MCI.
In the present study, we tested whether healthy individuals who convert to MCI exhibits atrophy of the whole amygdala or its specific subfields. Based on previous evidence, 19 we expected to observe higher/selective effects on the accessory basal nucleus, the cortical nuclei, and the cortical transition area. To further investigate the specificity of amygdala atrophy in characterizing the progression of HC subjects to MCI, we incorporated structural measurements of regions exhibiting early signs of tau pathology, that is, the hippocampus and the whole cortical mantle. Based on the hypothesis of early involvement of the amygdala in AD‐related macrostructural degeneration, we hypothesized a significant association between the atrophy of amygdala subfields and cognitive decline in converter subjects. To test these predictions, we applied a semi‐automatic approach that combines probabilistic methods and a priori information from ex vivo MRI and histology to segment and quantitatively measure, subject‐by‐subject, the volume of each amygdala subfield. 20 Our study sample used the AD Neuroimaging Initiative 3 (ADNI‐3) and evaluated 97 HC individuals who underwent a longitudinal neurocognitive assessment to detect early signs of MCI. Subjects were assigned into two groups based on a clinical follow‐up: 75 individuals who remained stable within 48 months (s‐HC) and 22 who converted to MCI within 48 months (c‐HC). Finally, we examined whether the atrophy of the whole amygdala or distinct amygdala subfields correlates with variations of cognitive performance scores obtained at baseline or at the time of the MCI diagnosis.
RESEARCH IN CONTEXT
Systematic review: The early stage of Alzheimer's disease (AD) is a critical window for developing and implementing effective therapeutic interventions and promoting resilience to cognitive decline; however, identifying subjects at risk of developing AD still represents a tentative effort.
Interpretation: The current study found that the progression from healthy cognition to mild cognitive impairment (MCI) is associated with significant atrophy in the right amygdala and its constituent nuclei. Specifically, gray matter changes in three subfields showed a correlation with cognitive deficits and decline, while the whole cortex and hippocampus did not exhibit atrophy. These results highlight the importance of analyzing amygdala subfield atrophy and conducting follow‐ups to detect early cognitive decline in individuals initially classified as “cognitively healthy.”
Future directions: Future investigations should employ longitudinal designs with multiple time points, enabling a comprehensive examination of the dynamic processes involved in the transition from normal aging to MCI.
2. METHODS
Details on the study protocol are reported on the ADNI website (http://www.adni‐info.org). Figure S1 and Supplementary materials report the flow chart and details of the study sample selection.
2.1. Neuropsychological assessments
Participants underwent a comprehensive neuropsychological assessment, including the Rey Auditory Verbal Learning Test (RAVLT) 21 and Logical Memory II (LM), a subscale of the Wechsler Memory–Revised 22 to investigate memory and learning; the animal fluency test 23 and the Multilingual Naming Test–MINT 24 to assess language proficiency; the clock drawing test (CDT) to explore visuospatial functions, 25 and the Trail Making Test (TMT), parts A and B, to evaluate attention/executive functions. 26 In addition, the battery of tests on global functioning included the Mini‐Mental State Examination (MMSE) and the Montreal Cognitive Assessment (MoCA); the Functional Activities Questionnaire (FAQ) for the assessment of daily living activities 27 ; the Alzheimer's Disease Assessment Scale‐Cognitive subscales (ADAS‐11 items scores; ADAS‐13 items scores; ADAS‐Q4 delayed word recall subscale) to evaluate the severity of impairments of memory, learning, language, praxis, and orientation. 28 The Neuropsychiatric Inventory (NPI) and the Geriatric Depression Scale (GDS) were also administered to obtain information on behavioral disturbances. 29 , 30
2.2. MRI data acquisition and analysis
T1‐weighted images were processed with FreeSurfer 7.3 using the “recon‐all ‐all” command line (see details in Supplementary materials). The “segmentHA_T1.sh” script subsequently computed the parcellation and volume quantification of amygdala subfields. The amygdala was segmented into nine subfields for each hemisphere (Figure 1): the accessory basal nucleus, the anterior amygdaloid area (AAA), the basal nucleus, the central nucleus, the cortical‐amygdaloid transition area (CATA), the lateral nucleus, and the paralaminar nucleus. 20 The volumes were normalized (divided) by the estimated total intracranial volumes.
FIGURE 1.
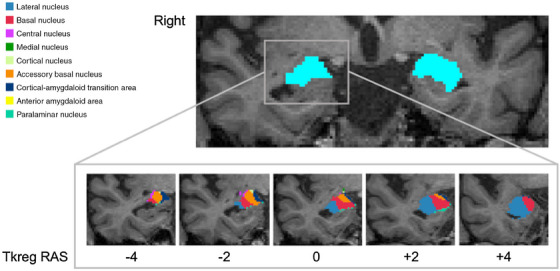
Representative image showing magnetic resonance imaging segmentation of the amygdala and its subfields. The upper panel shows the segmented left and right amygdala (colored in light blue). The lower panel displays the parcellation of the right amygdala into nine subfields. The images were in the neuroradiological convention.
2.3. Statistics
Group differences in demographics, neuropsychological measures, and imaging variables were assessed using two‐tailed independent t‐tests for continuous variables, while categorical variables were analyzed using chi‐square tests. Within the c‐HC group, Spearman's correlations were conducted to examine possible relationships between the volume of atrophic subfields and the neuropsychological outcomes that showed statistical differences between the two groups at baseline and at the 48‐month follow‐up. All analyses applied false discovery rate (FDR) correction to account for multiple comparisons.
3. RESULTS
3.1. Demographic and clinical features
The two groups were matched for age, sex, and educational level. In the analysis performed on behavioral tests at baseline (Table 1), the s‐HC and c‐HC subsets differed on measures of global cognition (ADAS‐11/13, MMSE), episodic memory learning and retrieval (RAVLT and LM, Immediate Recall, ADAS‐Q4, RAVLT‐DR/RN and LM Delayed Recall), visuospatial ability (CDT), animal fluency, and executive functions (TMT‐B). No between‐group differences were observed in other cognitive domains. The NPI total scores showed no significant differences when comparing the neuropsychiatric subscales that showed variance (ie, mean score >0). The GDS scores, examining the major depressive tract, were significantly higher in c‐HC individuals than in s‐HC subjects. We also examined the longitudinal variation in neuropsychological characteristics between the stable, healthy control s‐HC and the c‐HC groups. This analysis allowed us to track changes over time in these key aspects within each group and compare any observed differences between them. Table 2 shows that the c‐HC subsets exhibited a more significant impairment in global cognition measures such as the ADAS‐11/13 and FAQ. Additionally, there was an impairment in a test of immediate memory (RAVLT‐IR) and neuropsychiatric symptoms (NPI total scores).
TABLE 1.
Demographic, neuropsychological, and clinical characteristics assessed at baseline of two groups: stable (s‐HC) and converter healthy control (c‐HC).
| s‐HC subjects | c‐HC subjects | |||||
|---|---|---|---|---|---|---|
| Variables | Mean | SD | Mean | SD | p‐value | |
| Demographic information | Age | 74.8 | 6.3 | 75.6 | 7.5 | 0.599 |
| Educational level (years) | 17.3 | 2.3 | 16.2 | 2.7 | 0.076 | |
| N (% Male) | 35 (46.6%) | 9 (41%) | 0.361 a | |||
| General cognition | ADAS‐11 | 5.1 | 2.6 | 7.0 | 4.6 | 0.014 |
| ADAS‐13 | 7.7 | 4.0 | 11.5 | 7.5 | 0.002 | |
| MMSE | 29.4 | 0.8 | 27.9 | 1.8 | <0.001 | |
| MOCA | 25.9 | 5.8 | 23.3 | 5.8 | 0.075 | |
| FAQ | 0.2 | 0.7 | 0.4 | 0.7 | 0.360 | |
| Learning and Memory | RAVLT‐IR | 48.7 | 11.0 | 41.3 | 8.0 | 0.004 |
| RAVLT‐DR | 9.0 | 4.2 | 5.7 | 4.1 | 0.001 | |
| RAVLT‐RN | 13.1 | 2.5 | 11.3 | 3.0 | 0.005 | |
| RAVLT‐L | 5.4 | 2.4 | 5.6 | 2.4 | 0.689 | |
| RAVLT‐TOT | 13.8 | 1.9 | 12.1 | 2.6 | 0.001 | |
| ADAS‐Q4 | 2.3 | 1.7 | 3.6 | 2.9 | 0.011 | |
| LM‐IR | 15.7 | 3.2 | 12.4 | 4.8 | <0.001 | |
| LM‐DR | 14.7 | 3.5 | 10.7 | 4.2 | <0.001 | |
| Visual‐spatial ability | CDT | 4.8 | 0.5 | 4.5 | 0.7 | 0.013 |
| CDC | 4.8 | 0.5 | 4.6 | 1.1 | 0.158 | |
| Executive functions | TMT‐A | 29.4 | 7.9 | 32.0 | 1.8 | 0.210 |
| TMT‐B | 64.9 | 26.8 | 101.0 | 63.3 | <0.001 | |
| Language | AF | 22.7 | 4.9 | 20.4 | 3.9 | 0.042 |
| MINT SC | 0.3 | 0.7 | 0.5 | 0.7 | 0.143 | |
| MINT total | 29.7 | 6.3 | 28.7 | 3.1 | 0.457 | |
| Neuropsychiatry | NPI TOTAL | 1.2 | 2.7 | 1.4 | 2.9 | 0.752 |
| Depression | GDS | 0.7 | 1.1 | 1.6 | 2.5 | 0.018 |
Notes: Values are expressed as Mean ± Standard Deviation (SD). The tests showing a significant difference between groups are in bold.
Abbreviations: ADAS, Alzheimer's Disease Assessment Scale; ADAS‐Q4, ADAS delayed word recall subscale; AF, animal fluency; c, converter; CDC, clock drawing—copy score; CDT, clock drawing test, total score; FAQ, Functional Activities Questionnaire; GDS, Geriatric Depression Scale; HC, healthy controls; LM‐DR, Logical Memory‐Delayed Recall Total Number of Story Units Recalled; LM‐IR, Logical Memory‐Immediate Recall Total Number of Story Units Recalled; MINT, Multilingual Naming Test Correct (Uncued + Correct with Semantic cue); MMSE, Mini‐Mental State Examination; MoCA, Montreal Cognitive Assessment; NPI, Neuropsychiatric Inventory Questionnaire; RAVLT‐DR, Rey's Auditory Verbal Learning Test, 30 min Delayed Recall; RAVLT‐IR, Rey's Auditory Verbal Learning Test, Immediate Recall (sum of 5 trials); RAVLT‐L, Rey's Auditory Verbal Learning Test‐Learning score (Trial 5 − Trial 1); RAVLT‐RN, Rey's Auditory Verbal Learning Test Delayed Recognition; RAVLT‐TOT, Rey's Auditory Verbal Learning Test, Trials 1 through 6; s, stable; TMT, Trail Making Test.
chi‐square.
TABLE 2.
Longitudinal variation in demographic, neuropsychological, and clinical characteristics of the stable healthy control (s‐HC) and converter healthy control (c‐HC) groups.
| s‐HC subjects | c‐HC subjects | ||||||||
|---|---|---|---|---|---|---|---|---|---|
| Test | N | Mean | SD | N | Mean | SD | t | gl | p‐value |
| ADAS‐11 | 75 | −0.155 | 2.95 | 21 | 3.60 | 3.87 | −4.806 | 94 | <0.001 |
| ADAS‐13 | 75 | 0.552 | 4.07 | 21 | 4.80 | 5.48 | −3.898 | 94 | <0.001 |
| ADAS‐Q4 | 75 | 0.547 | 1.51 | 22 | 1.09 | 2.04 | −1.366 | 95 | 0.175 |
| MMSE | 73 | 1.36 | 4.99 | 22 | .863 | 2.82 | 0.441 | 93 | 0.660 |
| MOCA | 71 | −0.296 | 5.43 | 21 | 2.43 | 7.83 | −1.815 | 90 | 0.073 |
| FAQ | 70 | 0.114 | 1.08 | 22 | 1.41 | 3.38 | −2.808 | 90 | 0.006 |
| RAVLT‐IR | 75 | 2.05 | 7.67 | 22 | 6.36 | 4.54 | −2.504 | 95 | 0.014 |
| RAVLT‐DR | 75 | 0.773 | 3.96 | 22 | .636 | 3.53 | .146 | 95 | 0.884 |
| RAVLT‐RN | 75 | 0.853 | 3.63 | 22 | 0.273 | 3.55 | 0.663 | 95 | 0.509 |
| RAVLT‐TOT | 75 | 0.760 | 2.58 | 22 | −0.273 | 3.84 | 1.464 | 95 | 0.146 |
| RAVLT‐L | 75 | −0.280 | 2.73 | 22 | 0.091 | 2.94 | −0.551 | 95 | 0.583 |
| LM‐IR | 75 | −0.280 | 3.05 | 22 | 0.364 | 4.80 | −0.756 | 95 | 0.451 |
| LM‐DR | 75 | −0.013 | 2.91 | 22 | 0.773 | 3.37 | −1.076 | 95 | 0.285 |
| CDT | 75 | −0.053 | 0.490 | 22 | 0.046 | 1.68 | −0.453 | 95 | 0.651 |
| CDC | 75 | −0.080 | 0.610 | 22 | −0.182 | 1.18 | 0.543 | 95 | 0.588 |
| TMT‐A | 73 | 5.4 | 11.4 | 22 | 2.8 | 14.2 | 0.881 | 93 | 0.381 |
| TMT‐B | 73 | 14.2 | 31.0 | 22 | 1.5 | 81.5 | 0.314 | 93 | 0.754 |
| AF | 75 | 0.613 | 5.48 | 22 | 3.14 | 5.38 | −1.907 | 95 | 0.060 |
| MINT SC | 75 | −0.280 | 3.68 | 22 | 0.227 | 0.751 | −0.641 | 95 | 0.523 |
| MINT total | 75 | 0.253 | 9.92 | 22 | 5.05 | 11.7 | −1.913 | 95 | 0.059 |
| NPI TOTAL | 75 | 0.360 | 3.82 | 22 | 3.32 | 5.48 | −2.876 | 95 | 0.005 |
| GDS | 74 | 0.743 | 1.95 | 22 | 0.955 | 2.54 | −0.415 | 94 | 0.679 |
Notes: Values are expressed as Mean ± Standard Deviation (SD). The tests showing a significant difference between groups are in bold.
Abbreviations: ADAS, Alzheimer's Disease Assessment Scale; ADAS‐Q4, ADAS delayed word recall subscale; AF, animal fluency; c, converter; CDT, clock drawing test, total score; CDC, clock drawing—copy score; FAQ, Functional Activities Questionnaire; GDS, Geriatric Depression Scale; HC, healthy controls; LM‐DR, Logical Memory‐Delayed Recall Total Number of Story Units Recalled;LM‐IR, Logical Memory‐Immediate Recall Total Number of Story Units Recalled; MINT, Multilingual Naming Test Correct (Uncued + Correct with Semantic cue); MMSE, Mini‐Mental State Examination; MoCA, Montreal Cognitive Assessment; NPI, Neuropsychiatric Inventory Questionnaire; RAVLT‐DR, Rey's Auditory Verbal Learning Test, 30 min Delayed Recall; RAVLT‐IR, Rey's Auditory Verbal Learning Test, Immediate Recall (sum of 5 trials); RAVLT‐L, Rey's Auditory Verbal Learning Test‐Learning score (Trial 5 − Trial 1); RAVLT‐RN, Rey's Auditory Verbal Learning Test Delayed Recognition; RAVLT‐TOT, Rey's Auditory Verbal Learning Test, Trials 1 thorugh 6; s, stable; TMT, Trail Making Test.
3.2. MRI volumetry
C‐HC, compared to s‐HC individuals, exhibited a reduced volume of the right but not the left amygdala (Table 3). However, the atrophy of the right amygdala did not extend to all its subfields (Table 4; Figure 2). Compared with the s‐HC group, the c‐HC group showed significantly decreased volume in the lateral, basal, and accessory basal nuclei and the AAA and the CATA. Notably, we did not observe atrophy in the remaining subfields, even when considered without correction for multiple comparisons. No significant between‐group differences were observed in terms of hippocampal volume and whole‐brain thickness.
TABLE 3.
Volumetric analysis of the right and left amygdala.
| s‐HC subjects | c‐HC subjects | |||||||
|---|---|---|---|---|---|---|---|---|
| Structure volume/eTIV | Mean a | SD | Mean a | SD | t95 | FDR corrected p | Cohen's d | Effect size |
| L‐Amygdala | 0.00099 | 0.00013 | 0.00095 | 0.00014 | 1.317 | 0.366 | 0.319 | Small |
| R‐Amygdala | 0.00113 | 0.00015 | 0.00102 | 0.00016 | 2.740 | 0.042 | 0.664 | Intermediate |
| L‐Hippocampus | 0.00253 | 0.00025 | 0.00246 | 0.00030 | 1.171 | 0.366 | 0.284 | Small |
| R‐Hippocampus | 0.00262 | 0.00028 | 0.00248 | 0.00035 | 1.943 | 0.165 | 0.471 | Small |
Notes: Values are expressed as mean ± standard deviation (SD). The volumes showing a significant difference between groups are in bold.
Abbreviations: c, converter; eTIV, estimated Total Intracranial Volume; FDR, false discovery rate; HC, healthy controls; L, left; R, right; s, stable.
Values x10−4.
TABLE 4.
Volumetric analysis of the right amygdala subfields.
| s‐HC subjects | c‐HC subjects | Between‐group comparison | ||||||
|---|---|---|---|---|---|---|---|---|
| R‐Amygdala nucleus/eTIV | Mean a | SD a | Mean a | SD a | t95 | FDR p‐value | Cohen's d | Effect size |
| Lateral | 4.37 | 0.463 | 4.01 | 5.14 | 3.17 | 0.018 | 0.769 | Large |
| Basal | 2.94 | 0.35 | 2.74 | 3.45 | 2.30 | 0.047 | 0.558 | Intermediate |
| Accessory Basal | 1.69 | 0.22 | 1.56 | 2.68 | 2.41 | 0.047 | 0.584 | Intermediate |
| AAA | 0.34 | 0.06 | 0.33 | 0.05 | 2.27 | 0.047 | 0.550 | Intermediate |
| Central | 0.31 | 0.06 | 0.28 | 0.07 | 1.77 | 0.120 | 0.429 | Small |
| Medial | 0.15 | 0.04 | 0.14 | 0.04 | 0.94 | 0.349 | 0.228 | Small |
| Cortical | 0.17 | 0.03 | 0.15 | 0.03 | 1.62 | 0.123 | 0.393 | Small |
| CATA | 1.13 | .15 | 1.04 | 0.14 | 2.44 | 0.047 | 0.592 | Intermediate |
| Paralaminal | 3.34 | 0.40 | 3.24 | 0.35 | 1.60 | 0.117 | 0.388 | Small |
Notes: Values are expressed as Mean ± Standard Deviation (SD). The volumes showing a significant difference between groups are in bold.
Abbreviations: AAA, anterior amygdaloid area; c, converter; CATA, cortico‐amygdaloid transition area; eTIV, estimated Total Intracranial Volume; FDR, false discovery rate; HC, healthy controls; s, stable.
Values x10−4.
FIGURE 2.

Box plots displaying the within‐group distribution of magnetic resonance imaging measures for the atrophic subfields. This visualization allows for a comparison of the variability and range of the volume/eTIV measures between stable healthy control (s‐HC) and converter healthy control (c‐HC) subjects. Error bars represent the standard error. AAA, anterior amygdaloid area; CATA, cortical‐amygdaloid transition area.
3.3. Relationship of MRI measures with behavioral aspects at baseline
We then examined the correlation between the macrostructural alteration of the right amygdala subfields exhibiting significant atrophy in c‐HC and scores on the neuropsychological tests that revealed a significant group difference at baseline (Table S2). The lower volume of the right lateral nucleus, accessory basal nucleus, and AAA was associated with a more severe deficit in global cognition, as indicated by a negative correlation with the ADAS‐11/13 (higher scores) on these scales indicating more significant cognitive impairment. Furthermore, there was a positive correlation with the MMSE scores (lower scores on these scales indicate greater cognitive impairment). The right accessory basal nucleus atrophy was further positively associated with deficits of immediate memory, as indicated by a significant correlation with the RAVLT‐IR (lower scores on these scales indicate greater cognitive impairment). Notably, no significant correlation with the neuropsychological scores was observed when considering the whole right amygdala (Table S3).
3.4. Relationship of MRI measures with longitudinal behavioral tests
Finally, we assessed the presence of a significant correlation between the imaging outcomes and the longitudinal variation in cognitive and neuropsychiatric tests (Table 5). Specifically, we observed that the lower volume of the right lateral nucleus, basal accessory and basal nuclei, and AAA was associated with a more severe deficit in global cognition, as evidenced by a negative correlation with the ADAS‐11/13 and FAQ scores. Additionally, the atrophy of the right lateral nucleus, basal, and AAA was further associated with immediate memory performance, as indicated by a significant correlation with the RAVLT‐IR scores. No relationship was found between the whole amygdala volume and the longitudinal neuropsychological test scores (Table S4).
TABLE 5.
Relationships between the volume of atrophic amygdala nuclei and the longitudinal neuropsychological test scores showing significant variation during follow‐up.
|
Right lateral nucleus |
Right basal nucleus |
Right accessory basal nucleus |
Right AAA |
Right CATA |
||||||
|---|---|---|---|---|---|---|---|---|---|---|
| Test | rho | FDR corrected p | rho | FDR corrected p | rho | FDR corrected p | Rho | FDR corrected p | rho | FDR corrected p |
| ADAS‐11 | −0.576 | 0.008 | −0.509 | 0.008 | −0.573 | 0.013 | −0.508 | 0.008 | −0.542 | 0.164 |
| ADAS‐13 | −0.628 | 0.027 | −0.507 | 0.027 | −0.614 | 0.046 | −0.523 | 0.027 | −0.559 | 0.418 |
| RAVLT‐IR | 0.537 | 0.010 | 0.448 | 0.010 | 0.547 | 0.010 | 0.317 | 0.010 | 0.481 | 0.208 |
| FAQ | −0.574 | 0.027 | −0.559 | 0.027 | −0.551 | 0.189 | −0.607 | 0.015 | −0.507 | 0.347 |
Note: The significant correlations are in bold.
Abbreviations: AAA, anterior amygdaloid area; ADAS, Alzheimer's Disease Assessment Scale; CATA, cortico‐amygdaloid transition area; FAQ, Functional Activities Questionnaire; FDR, false discovery rate; RAVLT‐IR, Rey's Auditory Verbal Learning Test, Immediate Recall (sum of 5 trials).
4. DISCUSSION
The current study indicates that the clinical progression toward MCI is preceded by significant atrophy of the right amygdala and five constituent nuclei. Notably, only the macro‐structural gray matter alterations of three of these subfields, but not of the entire amygdala, showed a significant correlation with global cognitive deficits already observed at baseline and with the decline in global cognitive functions observed in MCI patients. Furthermore, our study revealed the absence of atrophy of the whole cortex and, in particular, of the hippocampus, a region that is an early target of AD pathology. While this finding supports the specificity of our results, it also suggests that the observed alterations in the amygdala subfields are not simply a reflection of generalized brain changes associated with AD. Furthermore, the absence of evident atrophy in other cortical/subcortical structures argues against the possibility that signs of amygdala atrophy reflect the loss of projecting axons/dendrites belonging to neurons located in other structures 31 rather than by local cellular loss. Thus, we stress the importance of incorporating amygdala subfield atrophy analysis and conducting clinical follow‐ups to identify individuals experiencing subclinical cognitive decline, particularly among those initially classified as “cognitively healthy” during the baseline evaluation.
4.1. Evidence for the atrophy of the amygdala in the progression to MCI
Converging evidence indicates that the amygdala is a crucial locus for the transition from a harmless clinical condition to a more aggressive disease since multiple protein types (Aβ, tau, a‐synuclein, and TDP‐43) are misfolded in this structure. 11 Post mortem studies have highlighted that, just following the MTL, the amygdala is primarily involved in AD‐related tau pathology. 12 Other studies have demonstrated that the rate of atrophy of the amygdala is similar to that of the hippocampus in mild 32 and full‐blown AD. 33 At the preclinical AD stage, the atrophy of the whole amygdala has been associated with cognitive deficits in visual, verbal, and emotional memory performance. 33 , 34
In agreement, morphological and functional changes have also been reported in the lateral nucleus of the amygdala of preclinical models of amyloid pathology. 35 Although the exact mechanisms of such region‐specific vulnerability are still unclear, recent findings indicate that early inflammatory processes in the amygdala could contribute to the neuronal demise observed with AD progression. 36
The present results confirm and extend the findings of previous studies indicating atrophy of the whole amygdala in individuals with subjective cognitive decline 16 , 17 and in Aβ‐positive subjects with concurrent cognitive deficits. 15 We show that signs of atrophy can be detected before the manifestation of deficits contributing to the classification of MCI, indicating that the c‐HC population is biologically distinguishable from s‐HC individuals. These results are consistent with the recent work of Stouffer and colleagues, 10 who highlighted the emergent role of the amygdala in AD progression, showing a significantly faster rate of atrophy, paralleling the entorhinal cortex, in HC who progress to MCI and in MCI converting to AD, when compared with individuals who remain stable. 10
The lateralization of atrophy in AD has been extensively debated. Previous MRI studies have produced conflicting results, with studies suggesting higher susceptibility to neurodegeneration in the left 37 or in the right hemisphere. 5 , 10 , 16 Our findings support the latter view, revealing a selective right‐lateralized pattern of neuronal loss, which agrees with our 5 and previous findings by other groups. 16 and Stouffer and colleagues. 10
4.2. Anatomical specificity of amygdala's atrophy
The amygdala is a heterogeneous structure consisting of basolateral, centromedial, and cortical nuclear complexes with extensive connections with several cortical and subcortical structures. 13 Its constituent nuclei are segregated not only by their architecture and connectivity patterns but also by their vulnerability to age‐related neurodegenerative disorders. 18 Based on a seminal study 19 that reported a specific accumulation of AD‐related neuropathology in nuclei with a bidirectional connection with the hippocampus (eg, the accessory basal nucleus, cortical nuclei, and the cortical transition area), we hypothesized that they might also show early signs of atrophy in individuals who will eventually manifest cognitive decline. Our results are, in large part, consistent with this prediction.
We observed that when compared with s‐HC individuals, c‐HC subjects were characterized by selective atrophy in the right basolateral nuclear complex, a heterogeneous structure encompassing the lateral nucleus, the basal nucleus, and the accessory basal nucleus. The basolateral nuclear complex, by its multiple connections with cortical and subcortical regions, 13 participates in a wide range of cognitive functions such as the processing and integration of multimodal stimuli, associative and emotional learning, as well as episodic memory formation, consolidation, and retrieval. 13 Our findings also match previous evidence reporting that the amygdala's accessory basal and lateral nuclei display shape changes and volumetric loss ranging from 14% to 60% in AD patients compared to HC subjects. 32 , 38
Other nuclei showing atrophy in c‐HC compared to s‐HC individuals were the superficial amygdala subnuclei such as the AAA and CATA. Anatomically, the AAA corresponds to the most rostral and dorsal portion of the amygdaloid complex. 38 , 39 At the pathological level, AAA atrophy has been associated with AD. 40 The AAA, through its multiple connections with the hippocampus, basal forebrain, and brainstem cholinergic structures, 11 is involved in sustaining attention and memory. 41 It is well known that cholinergic deficits play a key role in the neuropathology of AD, not only in late disease but also in preclinical and early stages. 42 Accumulated abnormal phosphorylated tau has been found specifically in the cholinergic neurons of the basal forebrain in cognitively normal older adults and MCI patients. It correlates with performance in memory tasks. 43 Furthermore, cholinergic pathology (eg, thickened cholinergic nerve fibers and ballooned terminals) has been found in middle‐aged adults. The process increases with age, suggesting that cholinergic loss in established AD is preceded by preclinical alterations. 44
The underlying mechanism may be sustained by the anatomic location of cholinergic pathways (eg, the nucleus basalis magnocellularis) in the cortico‐limbic belt of the forebrain, which includes limbic structures such as the amygdala, hippocampus, and entorhinal cortex. All of those regions are highly vulnerable to neurofibrillary degeneration and neurofibrillary tangle formation starting from the early stages of AD. 45 On the other hand, the CATA is part of the so‐called “olfactory amygdala.” It has strong connections with the olfactory bulbs, hippocampal formation, and parahippocampal cortices, supporting its involvement in memory and general cognition. 14 The atrophy of the CATA is in line with previous evidence showing the subcortical origin and ascending propagation of the AD‐related tau cytoskeletal pathology 46 as well as with a recent study by Kamath and colleagues 47 reporting a relationship between olfactory impairment and smaller amygdala GM volume in HC elderly subjects.
4.3. Relationship with cognitive decline
Further support for the anatomical specificity of the amygdala's atrophy comes from the analysis of the relationship with the scores of neuropsychological tests, which differentiate between c‐HC and s‐HC individuals at baseline and the 48‐month follow‐up. While the measure of global atrophy showed no significant association with indicators of cognitive performance, the volume of three out of five identified subfields showed a significant association with the degree of global cognitive functioning at baseline, as assessed by the MMSE and ADAS‐Cog‐11/13. This result is particularly intriguing, as the structural integrity of amygdala subfields appears to track the onset of subtle cognitive deficits that only manifest later at the individual level. Notably, the volume of the same nuclei displayed a similar relationship with the decline of general cognitive functions observed when patients are finally diagnosed with MCI.
It is important to stress that the observation of a significant correlation between amygdala atrophy and neuropsychological assessment does not imply a causal relationship between these two variables. It is plausible that the two phenomena are independent expressions of the same underlying cause, that is, the MCI progression. However, some recent findings suggest a close relationship between amygdala atrophy and memory performance. 48 , 49 For example, the link between the atrophy of the accessory basal nucleus and the impairment in immediate memory, measured by the RAVLT‐IR, that we observed in the present study fits well with the results of a machine‐learning approach that demonstrated that amygdala atrophy is among the best predictors for estimating immediate scores on the RAVLT. 49 However, we did not find a significant relationship between the atrophy of distinct amygdala subfields and specific measures of delayed memory (eg, RAVLT‐DR/RN, ADAS‐Q4 subscale), as would be expected based on the role of the amygdala in long‐term memory retrieval 14 and the centrality of episodic memory deficits along the AD spectrum. One possible explanation for this apparent discrepancy is that the amygdala predominantly supports memory for emotionally arousing experiences 50 by biasing activity in other MTL structures. In contrast, standard neuropsychological batteries typically focus on the encoding and retrieval of emotionally neutral information. According to this view, a significant association might be found when looking at memory for emotionally‐charged events, a hypothesis that should be tested in future studies. Finally, the more significant longitudinal variation in NPI total scores in c‐HC subjects than in s‐HC individuals vis‐a‐vis the amygdala's role in emotional functioning suggests a possible association between morphometric alteration and neuropsychiatric symptoms. However, the lack of a significant correlation between the MRI measures and the NPI total score is more consistent with the view that the significant increase of longitudinal NPI in converters co‐occurs with the other underlying neuropathology rather than being a direct manifestation of the amygdala's atrophy. In general, further studies are needed to assess the nature of the association between neural and neuropsychological early signs of MCI progression. These studies should include more specific scales targeting emotions and mood, as well as their relationship with episodic memory, but also specific analyses (eg, predictive, longitudinal) able to assess the presence of a causal relationship between variables.
4.4. Study limitations
Finally, we recognize that our study has some limitations. First, despite the richness of the ADNI3 database, the resulting sample size used in the present study was relatively small. However, our study cohorts underwent stringent inclusion criteria for the definition of both s‐HC and c‐HC subjects. In that regard, our descreening procedure for selecting the study sample, based on follow‐up data (ie, same diagnosis after 48 months), allowed us to define s‐HC subjects better. Additional studies would be needed to confirm and extend the present results in larger cohorts. Second, this study is cross‐sectional because we analyzed and compared data at baseline. Considering the usefulness of longitudinal analyses in detecting temporal variations in GM volume deterioration with significantly improved volumetric reliability, 51 future studies should investigate differences across multiple time points to unravel the dynamic processes underpinning the normal aging to MCI transition. Third, we opted for a semi‐automated method as it allows the processing of large samples. However, we acknowledge that semi‐automated methods (implemented in FreeSurfer, ANTS, and FSL) can also overestimate the amygdala's volume 52 compared with manual segmentation, which is still considered the gold standard. However, the semi‐automatic method used in the present work has been shown to minimize the risk of volume overestimation compared to other methods. 52 Segmentation algorithms integrated into FreeSurfer use ex vivo MRI data from autopsy brains to delineate the amygdala nuclei and construct a probabilistic atlas of amygdala anatomy. 20 Specifically, nine amygdala nuclei were parceled based on human and animal histology literature and the knowledge of boundaries visible in the ex vivo images. Crucially, this tool has already been applied to standard‐resolution T1 data from the ADNI dataset, successfully discriminating between participants with AD and control participants based on the amygdala's subfield. 20 Therefore, our study translated an already established method to study a different population. Moreover, compared with approaches that aim to estimate probability maps in reference spaces, the present approach considers individual underlying anatomy, thus providing greater spatial sensitivity. While these previous studies employed slightly larger sample sizes, the present study harnesses recent advancements in probabilistic modeling (ie, Bayesian modeling) to consider individual anatomy to parcellate the amygdala's nuclei. Fourth, another critical limitation of this study is the lack of specific measurements for affective disturbances and sensory processing that may be present in the whole AD spectrum and its preclinical stage. Implementing more tailored questionnaires would allow the exploration of associations between neuropsychological and morphometric variations. Fifth, we did not distinguish between non‐amnestic and amnestic MCI groups because the size of the sample was inadequate, and the clinical information from ADNI‐3 does not permit distinguishing between subgroups easily.
5. CONCLUSIONS
Our results shed light on the amygdala's involvement in the preclinical stage of AD, suggesting that GM atrophy of its specific nuclei predicts the cognitive decline and the prodromal progression of HC subjects to MCI, independently from the future clinical evolution.
CONFLICT OF INTEREST STATEMENT
The authors declare no conflicts of interest. Author disclosures are available in the Supporting information.
Supporting information
Supporting Information
Supporting Information
ACKNOWLEDGMENTS
Data collection and sharing for this project was funded by the Alzheimer's Disease Neuroimaging Initiative (ADNI) (National Institutes of Health Grant U01 AG024904) and DOD ADNI (Department of Defense award number W81XWH‐12‐2‐0012). ADNI is funded by the National Institute on Aging, the National Institute of Biomedical Imaging and Bioengineering, and through generous contributions from the following: AbbVie, Alzheimer's Association; Alzheimer's Drug Discovery Foundation; Araclon Biotech; BioClinica, Inc.; Biogen; Bristol‐Myers Squibb Company; CereSpir, Inc.; Cogstate; Eisai Inc.; Elan Pharmaceuticals, Inc.; Eli Lilly and Company; EuroImmun; F. Hoffmann‐La Roche Ltd and its affiliated company Genentech, Inc.; Fujirebio; GE Healthcare; IXICO Ltd.; Janssen Alzheimer Immunotherapy Research & Development, LLC.; Johnson & Johnson Pharmaceutical Research & Development LLC.; Lumosity; Lundbeck; Merck & Co., Inc.; Meso Scale Diagnostics, LLC.; NeuroRx Research; Neurotrack Technologies; Novartis Pharmaceuticals Corporation; Pfizer Inc.; Piramal Imaging; Servier; Takeda Pharmaceutical Company; and Transition Therapeutics. The Canadian Institutes of Health Research is providing funds to support ADNI clinical sites in Canada. Private sector contributions are facilitated by the Foundation for the National Institutes of Health (www.fnih.org). The grantee organization is the Northern California Institute for Research and Education, and the study is coordinated by the Alzheimer's Therapeutic Research Institute at the University of Southern California. ADNI data are disseminated by the Laboratory for Neuro Imaging at the University of Southern California. This work was supported by Search of Excellence (University “G. d'Annunzio” of Chieti‐ Pescara; Dr. Stefano Delli Pizzi); the Italian Ministry of Health, the AIRAlzh Onlus (ANCC‐COOP, Stefano L. Sensi), the Alzheimer's Association—Part the Cloud: Translational Research Funding for Alzheimer's Disease (18PTC‐19‐602325, Stefano L. Sensi) and the Alzheimer's Association—GAAIN Exploration to Evaluate Novel Alzheimer's Queries (GEENA‐Q‐19‐596282, Stefano L. Sensi).
Padulo C, Sestieri C, Punzi M, et al. Atrophy of specific amygdala subfields in subjects converting to mild cognitive impairment. Alzheimer's Dement. 2023;9:e12436. 10.1002/trc2.12436
Data used in preparation of this article were obtained from the Alzheimer's Disease Neuroimaging Initiative (ADNI) database (adni.loni.usc.edu). As such, the investigators within the ADNI contributed to the design and implementation of ADNI and/or provided data but did not participate in the analysis or writing of this report. A complete listing of ADNI investigators can be found at: http://adni.loni.usc.edu/wp‐content/uploads/how_to_apply/ADNI_Acknowledgement_List.pdf
Contributor Information
Stefano Delli Pizzi, Email: stefano.dellipizzi@unich.it.
Stefano L. Sensi, Email: stefano.sensi@unich.it.
REFERENCES
- 1. Hampel H, Lista S. The rising global tide of cognitive impairment. Nat Rev Neurol. 2016;12(3):131‐132. [DOI] [PubMed] [Google Scholar]
- 2. Kepp KP, Robakis NK, Høilund‐Carlsen PF, Sensi SL, Vissel B. The amyloid cascade hypothesis: an updated critical review. Brain. 2023;15: awad159. [DOI] [PubMed] [Google Scholar]
- 3. Arenaza‐Urquijo EM, Vemuri P. Resistance vs resilience to Alzheimer disease: clarifying terminology for preclinical studies. Neurology. 2018;90(15):695‐703. [DOI] [PMC free article] [PubMed] [Google Scholar]
- 4. Delli Pizzi S, Granzotto A, Bomba M, Frazzini V, Onofrj M, Sensi SL. Acting before: a combined strategy to counteract the onset and progression of dementia. Curr Alzheimer Res. 2020;17(9):790‐804. [DOI] [PubMed] [Google Scholar]
- 5. Delli Pizzi S, Punzi M, Sensi, SL , Alzheimer's Disease Neuroimaging Initiative. Functional signature of conversion of patients with mild cognitive impairment. Neurobiol Aging. 2019;74:21‐37. [DOI] [PubMed] [Google Scholar]
- 6. Platero C, Tobar MC, Alzheimer's Disease Neuroimaging Initiative. Predicting Alzheimer's conversion in mild cognitive impairment patients using longitudinal neuroimaging and clinical markers. Brain Imaging Behav. 2021;15(4):1728‐1738. [DOI] [PubMed] [Google Scholar]
- 7. Duara DA, Loewenstein E, Potter J, et al. Medial temporal lobe atrophy on MRI scans and the diagnosis of Alzheimer disease. Neurology. 2008;71(24):1986‐1992. DOI: [DOI] [PMC free article] [PubMed] [Google Scholar]
- 8. Lauriola M, Esposito R, Pizzi SD, et al. Sleep changes without medial temporal lobe or brain cortical changes in community‐dwelling individuals with subjective cognitive decline. Alzheimers Dement. 2017;13(7):783‐791. [DOI] [PMC free article] [PubMed] [Google Scholar]
- 9. Nosheny RL, Insel PS, Mattsson N, et al. Associations among amyloid status, age, and longitudinal regional brain atrophy in cognitively unimpaired older adults. Neurobiol Aging. 2019;82:110‐119. [DOI] [PMC free article] [PubMed] [Google Scholar]
- 10. Stouffer KM, Chen C, Kulason S, et al. Early amygdala and ERC atrophy linked to 3D reconstruction of rostral neurofibrillary tau tangle pathology in Alzheimer's disease. NeuroImage Clin. 2023;38:103374. [DOI] [PMC free article] [PubMed] [Google Scholar]
- 11. Nelson PT, Abner EL, Patel E, et al. The amygdala as a locus of pathologic misfolding in neurodegenerative diseases. J Neuropathol Exp Neurol. 2018;77(1):2‐20. [DOI] [PMC free article] [PubMed] [Google Scholar]
- 12. Braak H, Del Tredici K. The preclinical phase of the pathological process underlying sporadic Alzheimer's disease. Brain. 2015;138:2814‐2833 [DOI] [PubMed] [Google Scholar]
- 13. Benarroch EE. The amygdala: functional organization and involvement in neurologic disorders. Neurology. 2015;84(3):313‐324. [DOI] [PubMed] [Google Scholar]
- 14. LeDoux J. The amygdala. Curr Biol. 2007;17(20):R868‐R874. [DOI] [PubMed] [Google Scholar]
- 15. Abiose O, Deters KD, Young C, Mormino EC. Amygdala tau in preclinical Alzheimer's disease: neuroimaging/normal brain aging. Alzheimers Dement. 2020;16: e046762. 10.1002/alz.046762 [DOI] [Google Scholar]
- 16. Yue L, Hu D, Zhang H, et al. Prediction of 7‐year conversion from subjective cognitive decline to mild cognitive impairment. Hum Brain Mapp. 2021;42(1):192‐203. [DOI] [PMC free article] [PubMed] [Google Scholar]
- 17. Zanchi D, Giannakopoulos P, Borgwardt S, Rodriguez C, Haller S. Hippocampal and amygdala gray matter loss in elderly controls with subtle cognitive decline. Front Aging Neurosci. 2017;9:50. [DOI] [PMC free article] [PubMed] [Google Scholar]
- 18. Simic G, Kostovic I, Winblad B, Bogdanovic N. Volume and number of neurons of the human hippocampal formation in normal aging and Alzheimer disease. J Comp Neurol. 1997;379:482‐494. [DOI] [PubMed] [Google Scholar]
- 19. Vogt LK, Hyman BT, Van Hoesen GW, Damasio, AR . Pathological alterations in the amygdala in Alzheimer's disease. Neuroscience. 1990;37(2):377‐385. [DOI] [PubMed] [Google Scholar]
- 20. Saygin ZM, Kliemann D, Iglesias JE, et al. High‐resolution magnetic resonance imaging reveals nuclei of the human amygdala: manual segmentation to automatic atlas. NeuroImage. 2017;155:370‐382. [DOI] [PMC free article] [PubMed] [Google Scholar]
- 21. Rey A. (Eds.). L'examen clinique en psychologie. Presses Universitaires de France; 1964. [Google Scholar]
- 22. Wechsler D. Wechsler Memory Scale Revised: Manual; 1987. [Google Scholar]
- 23. Morris JC, Heyman A, Mohs RC, et al. The Consortium to Establish a Registry for Alzheimer's Disease (CERAD). Part I. Clinical and neuropsychological assessment of Alzheimer's disease. Neurology. 1989:39. [DOI] [PubMed] [Google Scholar]
- 24. Gollan TH, Weissberger GH, Runnqvist E, Montoya RI, Cera CM. Self‐ratings of spoken language dominance: a multilingual naming test (MINT) and preliminary norms for young and aging Spanish‐English bilinguals. Biling Lang Cogn. 2012;15(3):594‐615. [DOI] [PMC free article] [PubMed] [Google Scholar]
- 25. Mainland BJ, Amodeo S, Shulman KI. Multiple clock drawing scoring systems: simpler is better. Int J Geriatr Psychiatry. 2014;29:127‐136. [DOI] [PubMed] [Google Scholar]
- 26. Spreen O, Strauss E, Compendium of Neuropsychological Tests. Oxford University Press; 1998. [Google Scholar]
- 27. Pfeffer RI, Kurosaki TT, Harrah CH Jr, Chance JM, Filos S. Measurement of functional activities in older adults in the community. J Gerontol. 1982;37(3):323‐329. [DOI] [PubMed] [Google Scholar]
- 28. Mohs RC, Knopman D, Petersen RC, et al. Development of cognitive instruments for use in clinical trials of antidementia drugs: additions to the Alzheimer's Disease Assessment Scale that broaden its scope. The Alzheimer's Disease Cooperative Study. Alzheimer Dis Assoc Disord. 1997;11(Suppl 2):S13‐S21. [PubMed] [Google Scholar]
- 29. Cummings J. The Neuropsychiatric Inventory: Development and Applications. J Geriatr Psychiatry Neurol. 2020;33(2): 7384. 10.1177/0891988719882102 [DOI] [PMC free article] [PubMed] [Google Scholar]
- 30. Yesavage JA, Brink TL, Rose TL, et al. Development and validation of a geriatric depression screening scale: a preliminary report. J Psychiatr Res. 1982;17(1): 3749. 10.1016/00223956(82)900334 [DOI] [PubMed] [Google Scholar]
- 31. Vogel JW, Iturria‐Medina Y, Strandberg OT, et al. Alzheimer's Disease Neuroimaging Initiative; Swedish BioFinder Study. Spread of pathological tau proteins through communicating neurons in human Alzheimer's disease. Nat Commun. 2020;11:2612. [DOI] [PMC free article] [PubMed] [Google Scholar]
- 32. Poulin SP, Dautoff R, Morris JC, et al. Amygdala atrophy is prominent in early Alzheimer's disease and relates to symptom severity. Psychiatry Res Neuroimaging. 2011;194(1):7‐13. [DOI] [PMC free article] [PubMed] [Google Scholar]
- 33. Klein‐Koerkamp Y, Heckemann RA, Ramdeen KT, et al. Amygdalar atrophy in early Alzheimer's disease. Curr Alzheimer Res. 2014;11(3):239‐252. [DOI] [PubMed] [Google Scholar]
- 34. Mori E, Ikeda M, Hirono N, Kitagaki H, Imamura T, Shimomura T. Amygdalar volume and emotional memory in Alzheimer's disease. Am J Psychiatry. 1999;156(2):216‐222. [DOI] [PubMed] [Google Scholar]
- 35. Knafo S, Venero C, Merino‐Serrais P, et al. Morphological alterations to neurons of the amygdala and impaired fear conditioning in a transgenic mouse model of Alzheimer's disease. J Pathol. 2009;219:41‐51. 10.1002/path.2565 [DOI] [PubMed] [Google Scholar]
- 36. Folorunso OO, Harvey TL, Brown SE, Chelini G, Berretta S, Balu DT. The D‐serine biosynthetic enzyme serine racemase is expressed by reactive astrocytes in the amygdala of human and a mouse model of Alzheimer's disease. Neurosci. Lett. 2023, 792, 136958. [DOI] [PMC free article] [PubMed] [Google Scholar]
- 37. Wachinger C, Salat DH, Weiner M, Reuter M, Alzheimer's Disease Neuroimaging Initiative. Whole‐brain analysis reveals increased neuroanatomical asymmetries in dementia for hippocampus and amygdala. Brain. 2016;139(12):3253‐3266. [DOI] [PMC free article] [PubMed] [Google Scholar]
- 38. Miller MI, Younes L, Ratnanather JT, et al. Amygdalar atrophy in symptomatic Alzheimer's disease based on diffeomorphometry: the BIOCARD cohort. Neurobiol Aging. 2015;36:S3‐S10. [DOI] [PMC free article] [PubMed] [Google Scholar]
- 39. Tyszka JM, Pauli WM. In vivo delineation of subdivisions of the human amygdaloid complex in a high‐resolution group template. Hum Brain Mapp. 2016;37(11):3979‐3998. [DOI] [PMC free article] [PubMed] [Google Scholar]
- 40. Cavedo E, Boccardi M, Ganzola R, et al. Local amygdala structural differences with 3T MRI in patients with Alzheimer's disease. Neurology. 2011;76(8):727‐733. [DOI] [PMC free article] [PubMed] [Google Scholar]
- 41. Zheng F, Liu Y, Yuan Z, et al. Age‐related changes in cortical and subcortical structures of healthy adult brains: A surface‐based morphometry study. J Magn Reson Imaging. 2019;49(1):152‐163. [DOI] [PubMed] [Google Scholar]
- 42. Hampel H, Mesulam MM, Cuello AC, et al. The cholinergic system in the pathophysiology and treatment of Alzheimer's disease. Brain. 2018;141(7):1917‐1933. 10.1093/brain/awy132 [DOI] [PMC free article] [PubMed] [Google Scholar]
- 43. Mesulam M, Shaw P, Mash D, Weintraub S. Cholinergic nucleus basalis tauopathy emerges early in the aging‐MCI‐AD continuum. Ann Neurol. 2004;55:815‐828. [DOI] [PubMed] [Google Scholar]
- 44. Geula C, Nagykery N, Nicholas A, Wu CK. Cholinergic neuronal and axonal abnormalities are present early in aging and in Alzheimer's disease. J Neuropathol Exp Neurol. 2008;67:309‐318. [DOI] [PMC free article] [PubMed] [Google Scholar]
- 45. Mesulam MM. Cholinergic circuitry of the human nucleus basalis and its fate in Alzheimer's disease. J Comp Neurol. 2013;521:4124‐4144. [DOI] [PMC free article] [PubMed] [Google Scholar]
- 46. Stratmann K, Heinsen H, Korf HW, et al. Precortical phase of Alzheimer's disease (AD)‐related tau cytoskeletal pathology. Brain Pathol. 2016;26(3):371‐386. 10.1111/bpa.12289 [DOI] [PMC free article] [PubMed] [Google Scholar]
- 47. Kamath V, Senjem ML, Spychalla AJ, et al. The neuroanatomic correlates of olfactory identification impairment in healthy older adults and in persons with mild cognitive impairment. J Alzheimer's Dis. 2022;89(1):233‐245. [DOI] [PMC free article] [PubMed] [Google Scholar]
- 48. Basso M, Yang J, Warren L, et al. Volumetry of amygdala and hippocampus and memory performance in Alzheimer's disease. Psychiatry Res Neuroimaging. 2006;146(3):251‐261. [DOI] [PubMed] [Google Scholar]
- 49. Moradi E, Hallikainen I, Hänninen T, Tohka J, Alzheimer's Disease Neuroimaging Initiative. Rey's Auditory Verbal Learning Test scores can be predicted from whole brain MRI in Alzheimer's disease. NeuroImage Clin. 2017;13:415‐427. [DOI] [PMC free article] [PubMed] [Google Scholar]
- 50. Hermans EJ, Battaglia FP, Atsak P, de Voogd LD, Fernández G, Roozendaal B. How the amygdala affects emotional memory by altering brain network properties. Neurobiol Learn Mem. 2014;112:2‐16. [DOI] [PubMed] [Google Scholar]
- 51. Jovicich J, Marizzoni M, Sala‐Llonch R, et al. Brain morphometry reproducibility in multicenter 3 T MRI studies: a comparison of cross‐sectional and longitudinal segmentations. 2013. NeuroImage;83:472‐484. [DOI] [PubMed] [Google Scholar]
- 52. Morey RA, Petty CM, Xu Y, et al. A comparison of automated segmentation and m anual tracing for quantifying hippocampal and amygdala volumes. Neuroimage. 2009;45:855‐866. [DOI] [PMC free article] [PubMed] [Google Scholar]
Associated Data
This section collects any data citations, data availability statements, or supplementary materials included in this article.
Supplementary Materials
Supporting Information
Supporting Information