
FIGURE 3.
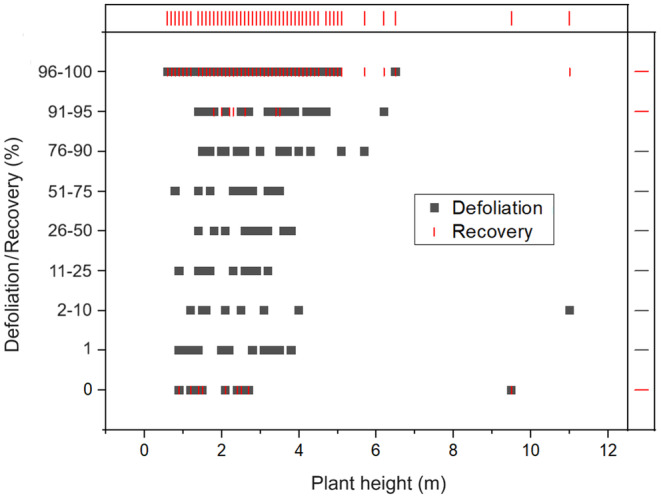
Scatter plot showing the distribution of defoliation and recovery data in relation to plant height.
Official websites use .gov
A
.gov website belongs to an official
government organization in the United States.
Secure .gov websites use HTTPS
A lock (
) or https:// means you've safely
connected to the .gov website. Share sensitive
information only on official, secure websites.
Scatter plot showing the distribution of defoliation and recovery data in relation to plant height.