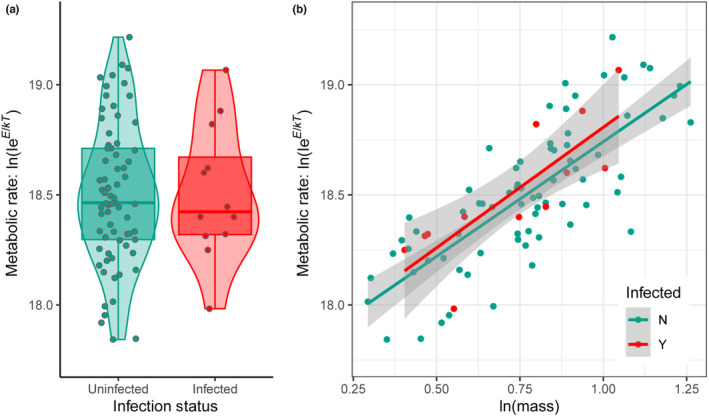
FIGURE 3.

Empirical estimation of metabolic theory of ecology parameters using respiration data (slope = scaling exponent, α; intercept = normalization constant, C = ln(i)). The y‐axis represents the log of temperature‐corrected individual metabolic rate. (a) Temperature‐corrected respiration rate for infected (n = 12) vs. uninfected (n = 73) three‐spined stickleback. (b) Linear regression models showing how metabolic rate depends on an interaction between host mass and infection status. Each point represents the respiration rate of an individual fish.
