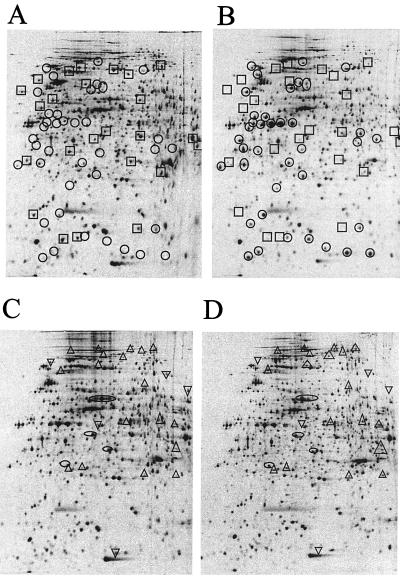
FIG. 4.
2D PAGE analysis of synthesized proteins. The growing liquid cultures (optical density at 450 nm = 1.5) were split in two, and inducers were added to one of the cultures. Twenty minutes later, cells were labeled with 30 μCi of 35[S]methionine per ml for 5 min. Cells were harvested and subjected to 2D PAGE analysis as described previously (16). Strains tested were MG3 (flhD) (A) and MG3/pMG600 (B) in the presence of 0.2 mM IPTG and MG44 (swrI) in the absence (C) and presence (D) of 2 μM BHL. ○ and □, proteins induced and repressed, respectively, by expression of flhDC. ▵ and ▿, proteins induced and repressed, respectively, by addition of BHL. ○, proteins that moved in a horizontal direction in response to BHL addition. The left and right sides correspond to pIs of 4 and 7, respectively, for proteins immobilized by isoelectric focusing (Pharmacia Immobiline strips). The top and bottom of the gel correspond to molecular masses of approximately 200 and 10 kDa, respectively.

