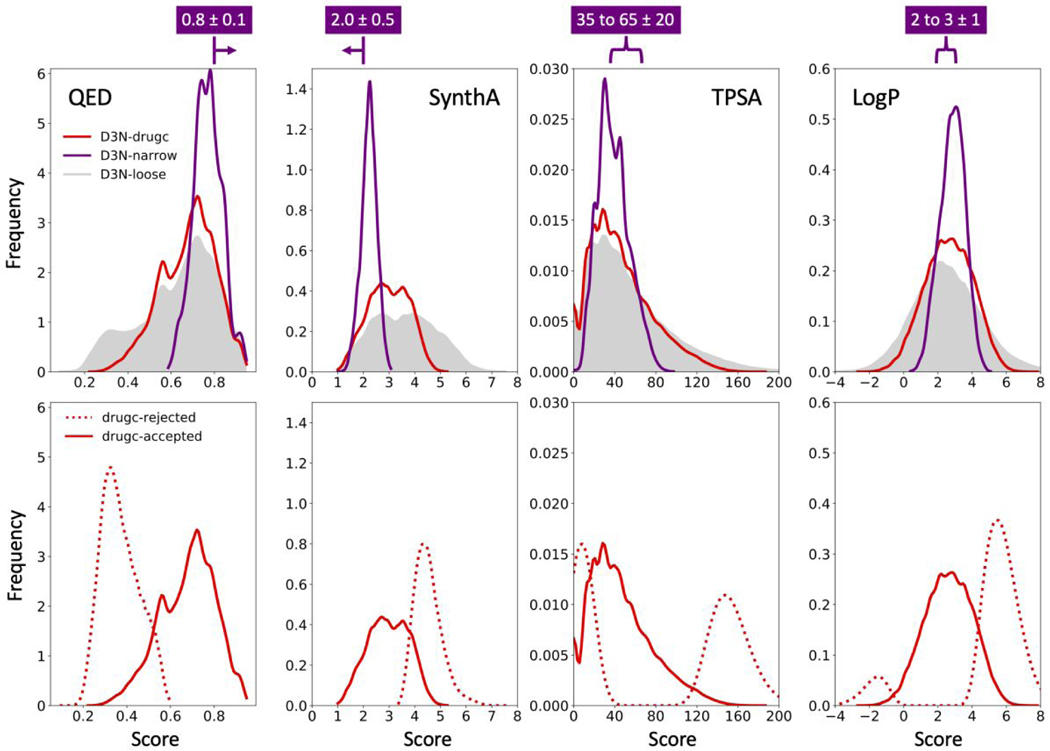
Figure 10.
QED, SynthA, TPSA and LogP distributions obtained using D3N-drugc (red), D3N-loose (gray shade) and D3N-narrrow (purple) in 57 protein binding sites starting from 15 fragments as anchors. D3N-drugc and D3N-loose target ranges listed in Table 3. D3N-narrow target ranges shown in purple above each plot. Bottom panels compare distributions for the D3N-drugc rejected (dashed red) and accepted (solid red) molecules. Distributions obtained by kernel density estimation. TPSA values in angstroms squared.

