Some NLM-NCBI services and products are experiencing heavy traffic, which may affect performance and availability. We apologize for the inconvenience and appreciate your patience. For assistance, please contact our Help Desk at info@ncbi.nlm.nih.gov.

. Author manuscript; available in PMC: 2024 Jul 25.
Published in final edited form as: J Chem Inf Model. 2023 Sep 12;63(18):5803–5822. doi: 10.1021/acs.jcim.3c01031

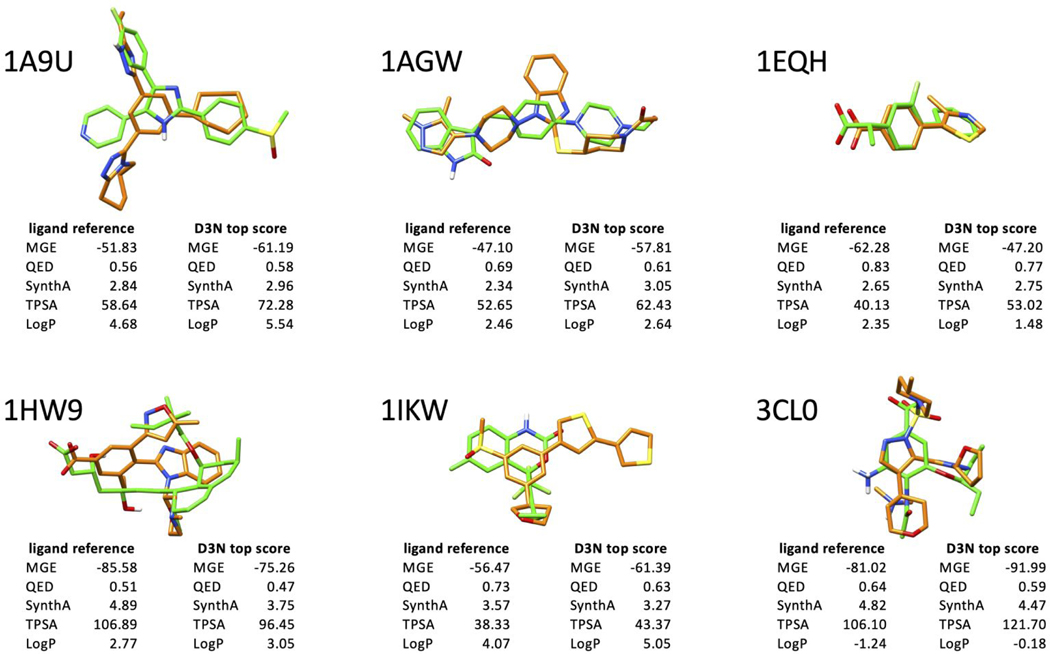
Figure 18.

Figure 18.

Comparison between the top-scoring D3N-pinpoint pose (orange), and its respective reference ligand pose (green), along with MGE energy, QED, SynthA, TPSA, and LogP scores. Protein residues hidden for clarity. MGE in kcal/mol. TPSA in angstroms squared.

HHS Vulnerability Disclosure