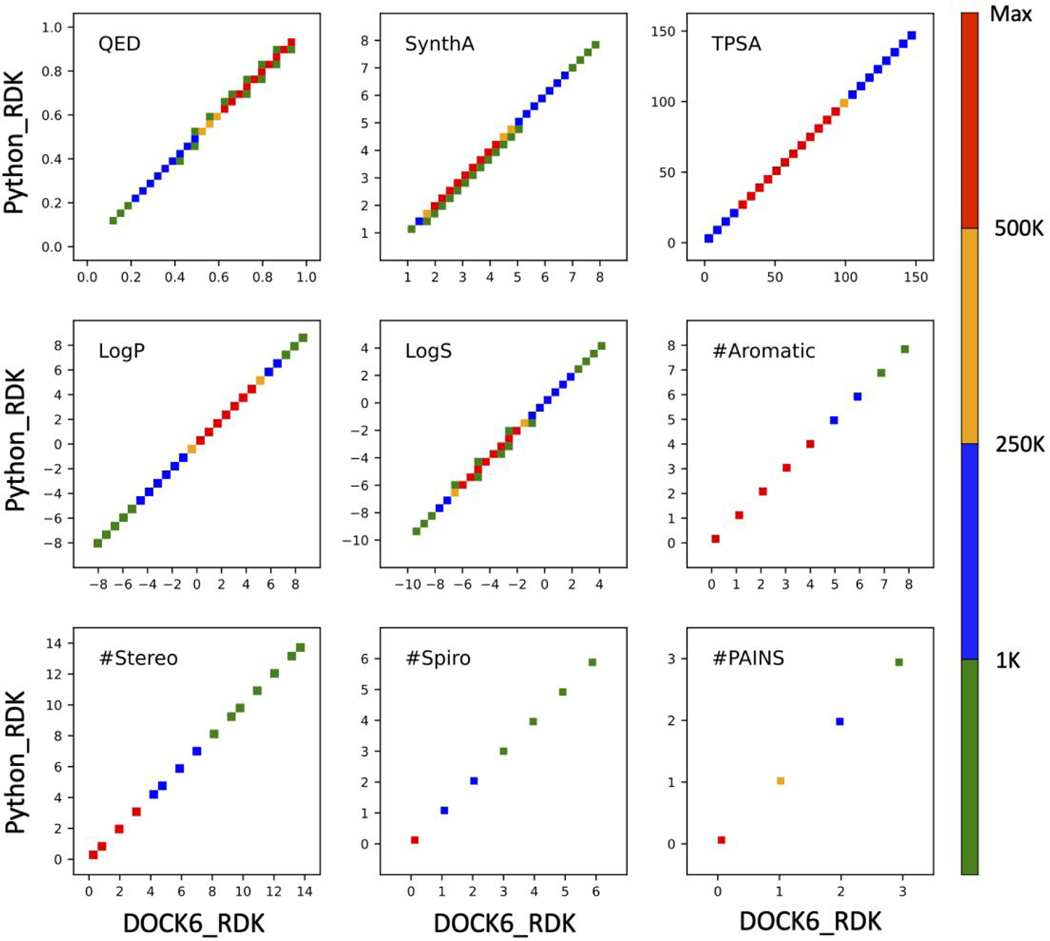
Figure 5.
Scatter plots for descriptors calculated using DOCK6/RDKit (DOCK6_RDK) vs Python/RDKit (Python_RDK) using 13M molecules downloaded from ZINC (ZINC13M dataset). Both sets of calculations employed the identical SMILES strings generated using DOCK6/RDKit from MOL2 files. Heatmap colors correspond to the number of molecules (population) across each descriptor range. TPSA values in angstroms squared.

