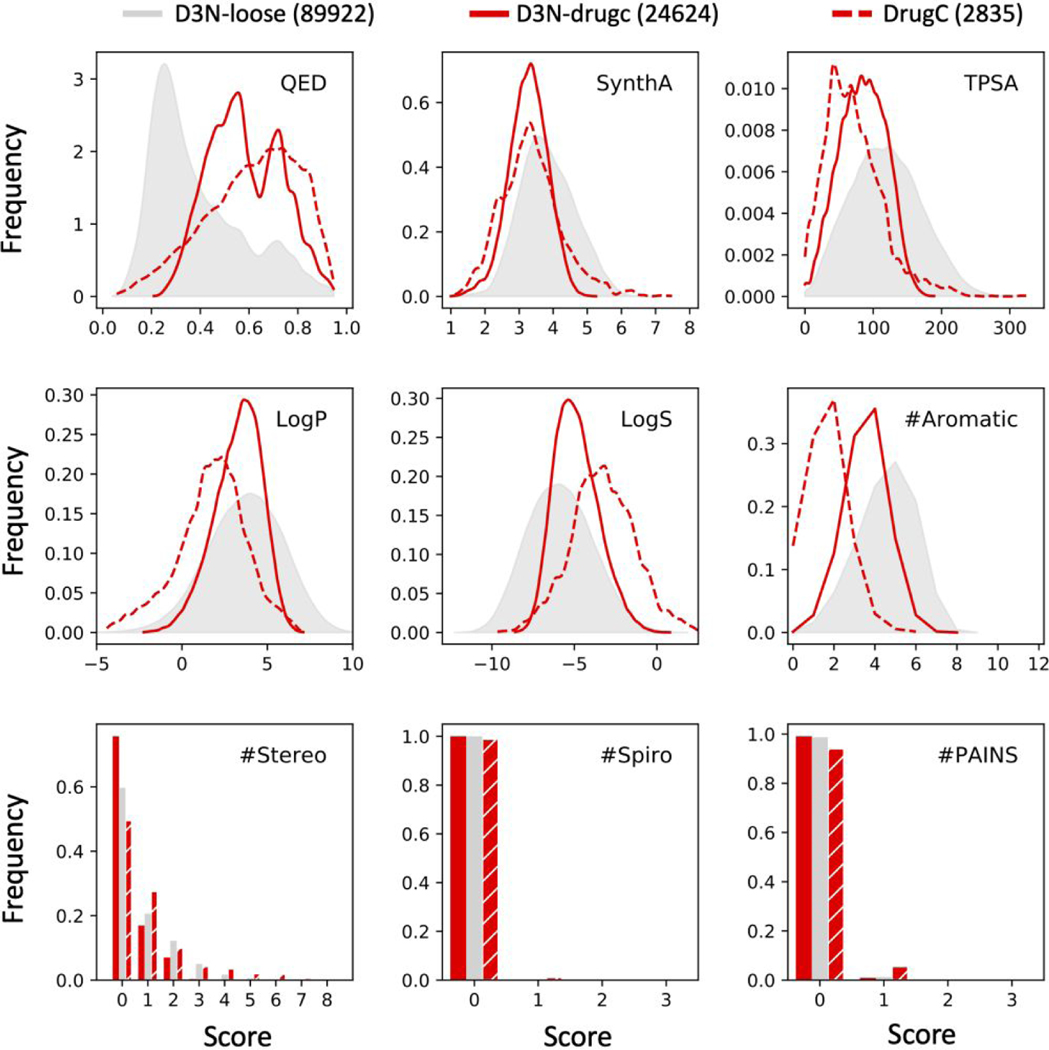
Figure 8.
Outcomes from multi-descriptor de novo design using D3N-drugc (solid red) protocols driving QED, SynthA, TPSA, LogP, and #Stereo simultaneously compared to D3N-loose (gray) as a control. The distributions for molecules in the DrugCentral data set (dashed red) are shown for comparison. Multi-descriptor target ranges listed in Table 3. Values in parenthesis specify how many molecules were generated with each protocol. TPSA values in angstroms squared.

