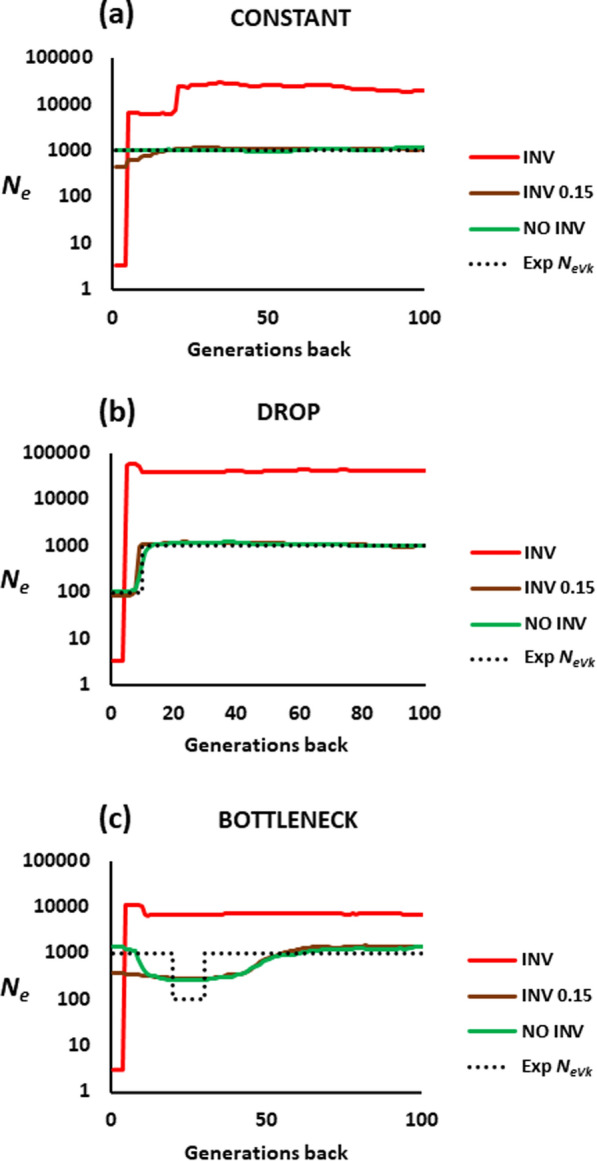
Fig. 6.

Estimates of the historical effective population size (Ne) obtained by the software GONE for a closed population with N = 1000 individuals carrying a large chromosomal inversion. The population was either a kept at a constant size, b subjected to a recent drastic drop, or c subjected to a bottleneck and later recovering of the previous size. The red lines correspond to the scenario where the inversion is present in the population at an intermediate frequency (around 0.5). The brown lines show the case for which the inversion is at a low frequency (0.15) in the population. The green lines refer to the estimated Ne values when the inverted region is discarded in the analysis. Finally, the black dotted line shows the expected Ne from the variance of the progeny number (NeVk)
