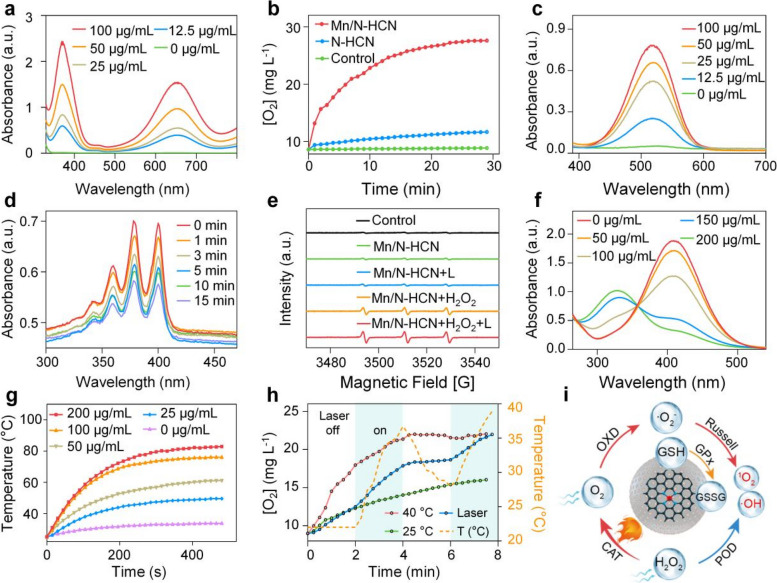
Fig. 2.
In vitro characterizations of the catalytic performance of Mn/N-HCN. A TMB assay for POD-mimic activity at different concentrations of Mn/N-HCN. B O2 generation from the decomposition of H2O2 (0.5 mM) due to CAT-mimic activity of N-HCN and Mn/N-HCN. C The •O2− assay kit detects •O2− production of Mn/N-HCN. The increased absorption peak at 530 nm confirms the production of •O2−. D ABDA assay for 1O2 generation by Mn/N-HCN. E ESR spectra of 1O2 at different conditions where L refers to laser irradiation and H2O2 concentration is 100 mM (The g value of Mn/N-HCN: g = 2.00665, Mn/N-HCN + L: g = 2.00666, Mn/N-HCN + H2O2: g = 2.00665, Mn/N-HCN + H2O2: g = 2.00664). F GSH depletion by Mn/N-HCN at different concentrations. G Heating curves of PBS solutions containing various amounts of Mn/N-HCN under laser irradiation. H O2 generation from the decomposition of H2O2 at 25 °C, 40 °C, or with 2 min laser on–off irradiation (while the temperature of the solution being continuously monitored). I Schematic illustration of coupled multi-nanocatalytic activities of Mn/N-HCN in tumor tissue. Note: The concentration of nanozyme is 100 μg/mL unless otherwise specified; the laser wavelength and power density are 1064 nm and 1 W/cm2, respectively

