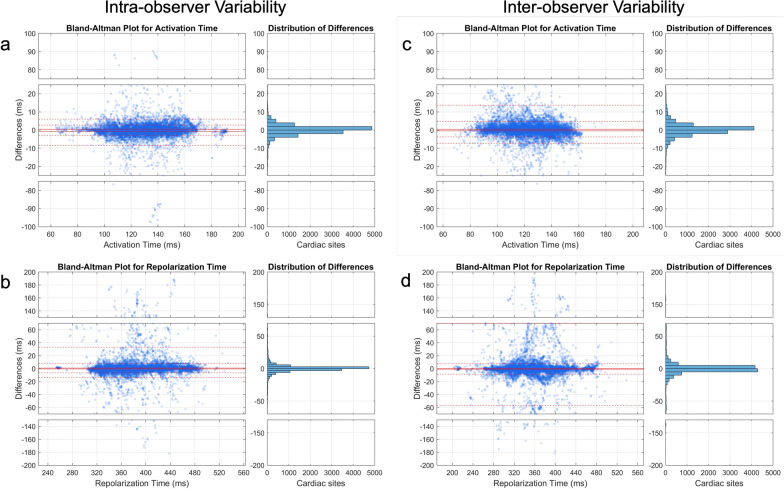
Fig. 5.
Bland–Altman plots and histogram for distribution of differences measuring the similarity across observers. a AT sequence similarity for intra-observer variability; b RT sequence similarity for intra-observer variability; c AT sequence similarity for inter-observer variability; d RT sequence similarity for inter-observer variability. Because between-observer differences were non-normally distributed, a non-parametric approach was adopted to estimate limits of agreement with the median used to assess bias and the 5th and 95th percentiles representing the lower and upper limits, respectively. The analysis was conducted for each case (considering all paired cardiac sites) across observers (n = 12,937 per case, represented by each dot). Confidence intervals for global limits of agreement were defined as the interquartile range of their distribution. Abbreviations as in Fig. 1

