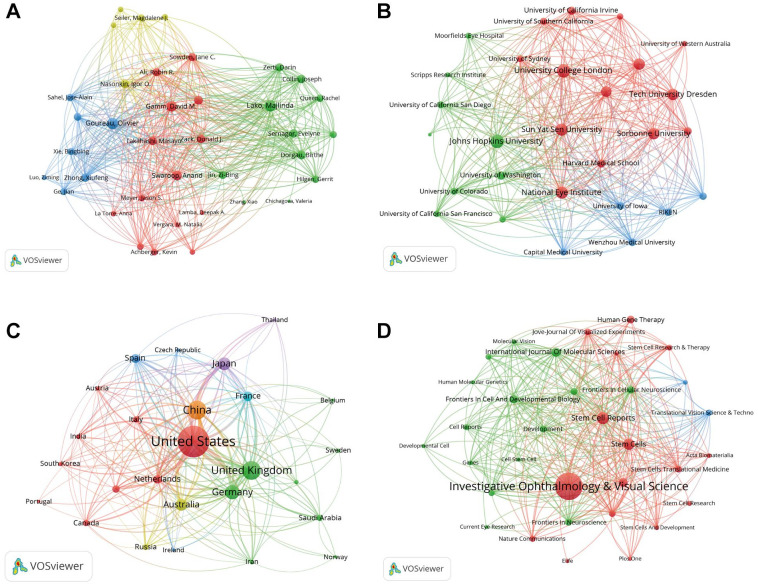
Figure 5.
Bibliographic coupling analysis of authors, institutions, countries/regions, and journals. (A) Mapping of the 2,430 authors. (B) Mapping of the 640 institutions. (C) Mapping of the 35 countries/regions. (D) Mapping of the 149 journals. The circle size represents the publication count; the link between different points represents the collaboration between authors/institutions/countries/regions/journals.

