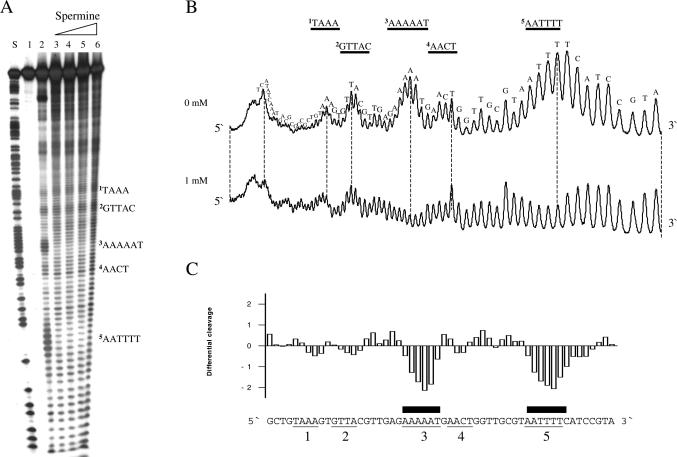
Figure 1.
Effect of spermine on uranyl cleavage of the tyrT promoter from E.coli. (A) Autoradiograph showing uranyl cleavage of the E.coli tyrT promoter in the absence and presence of 1, 2, 4 and 8 mM spermine (lanes 2–6). Lane 1 is the uncleaved free DNA and lane S is an A/G sequence reaction. Boldface letters on the right-hand side of the autoradiograph indicate the position of A-tracts and A/T-rich sequences. (B) Densitometric scans of the autoradiograph in (A) showing uranyl cleavage in the absence and presence of 1 mM spermine. The DNA sequence is annotated on the scan. Regions with A-tracts and AT-rich sequences are indicated and underlined. The orientation of the DNA is indicated with 5′ and 3′. (C) Differential cleavage plot comparing the susceptibility of the tyrT promoter DNA fragment to uranyl cleavage in the absence and in the presence of 1 mM spermine. Negative values correspond to a ligand-protected site, and positive values represent enhanced cleavage. The vertical scale is in units of ln(fa) − ln(fc), where fa is the fractional cleavage at any bond in the presence of polyamine and fc is the fractional cleavage of the same band in the control. Black boxes indicate the position of inhibition of uranyl cleavage in the presence of spermine. Regions with A-tracts and AT-rich sequences are indicated and underlined as in (A and B).

