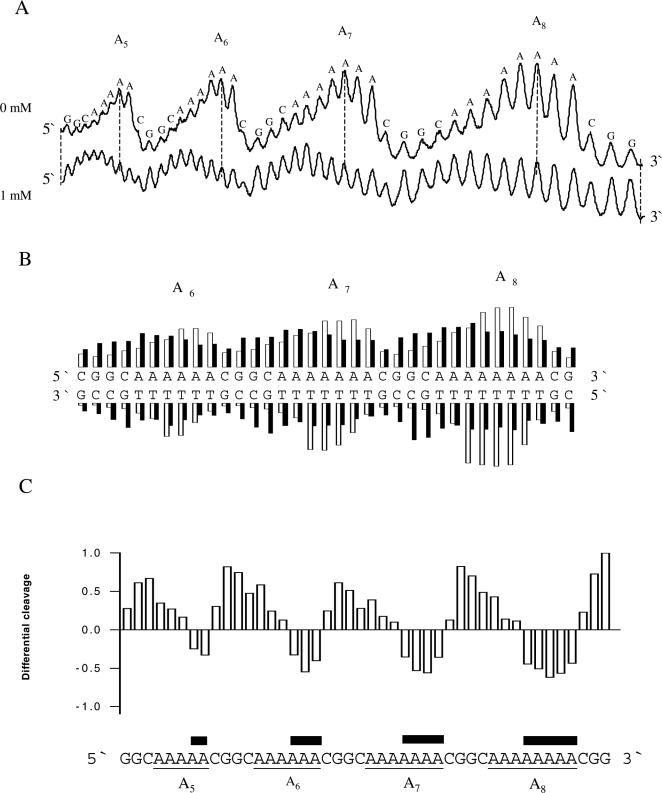
Figure 3.
Effect of spermidine on uranyl cleavage of plasmid pA1-8. (A) Densitometric scans of an autoradiograph presented in Figure 1A in the absence and presence of 1 mM spermidine. Numbers of adenines in the different A-tracts and the DNA sequence is annotated on the scan. (B) Uranyl cleavage of both strands of plasmid pA1-8 in the absence (white bars) and presence (black bars) of 1 mM spermidine. The cleavage intensities were measured with a densitometric scanning. (C) Differential cleavage plot comparing the susceptibility of the plasmid pA1-8 DNA fragment to uranyl cleavage in the absence and presence of 1 mM spermidine. Black boxes indicate the position of inhibition of uranyl cleavage in the presence of spermidine. Regions with A-tracts are indicated and underlined.

